Status Monitor
The Status Monitor window provides information on the communication link and most recent data collection attempts with the dataloggers in the network.
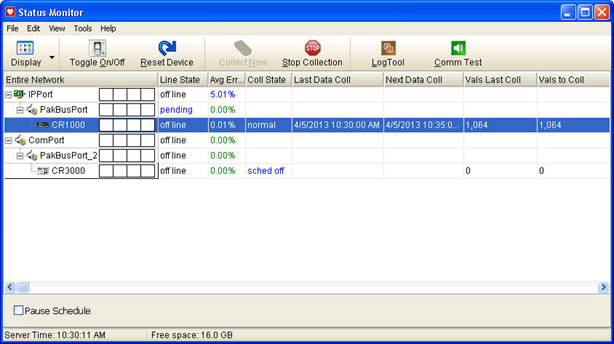
The datalogger network is depicted on the left side of the Status window. The communication status of each device can quickly be determined by the color of the icon associated with it. A green N ![]() indicates that communication is Normal; blue M
indicates that communication is Normal; blue M ![]() indicates that communication is Marginal; red C
indicates that communication is Marginal; red C ![]() indicates that communication is Critical; and gray U
indicates that communication is Critical; and gray U ![]() indicates that the communication state is unknown.
indicates that the communication state is unknown.
The graphical bar to the right of the device name ( ) is the communication history. It provides a quick summary of communication with that device over the past 24 hours (it is divided into four 6 hour periods). A green bar means there have been no retries and no failures for the period. A blue bar indicates there have been retries but no failures. A red bar indicates there have been failures. If a bar is gray, there have been no attempts to contact the device. The height of the bar (as a percentage of the height of the box) is determined by the following equation:
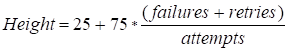
where
-
failures = number of communication failures
-
retries = number of communication retries
-
attempts = total number of communication attempts
The Communication History can be displayed in a larger view by right clicking within the history for a device and selecting Comm History from the short cut menu. Each segment of time in this larger view represents 10 minute intervals. Clicking on a segment will display the time period for the interval and the number of Attempts (A), Retries (R), and Failures (F) during that period. This information is provided by a pop-up above the history and by a line below the Communication History. (The pop-up can be turned off by clearing the Show Annotations check box.) The right and left arrow keys can be used to move right or left one segment at a time. You can zoom in on a particular interval by clicking and dragging your mouse cursor from the upper left of an area to the lower right of an area. (To return to normal view, click and drag from the right to the left.)
Information on the Status window can be sorted by column. Click on a column heading to sort the devices. For instance, if the Network Map column is clicked once, the devices will be sorted alphabetically by name. Clicking the column a second time will sort the devices in reverse alphabetical order, and a third time will restore the Network map to its original order.
Sorting on a column in the Status window can be an effective means to locate trouble spots, particularly with a large network. For example, sorting on the Avg Err% column can bring all those stations with high average error rates to the top, in order from highest average error rate to lowest average error rate. Sorting on Collection State can group the stations according to secondary retry mode, primary retry mode, normal collection schedule, and schedule off. Sorting on the Holes statistic can indicate the dataloggers having collection difficulties. Once you have located a station with difficulties, you can right-click on the station and select TroubleShooter to launch the diagnostic tool for the station.
For further explanation of the statistics available for display by the Status Monitor, see Select Columns .
Toolbar Buttons and Check Boxes
|
|
Allows you to choose to view the entire network or a subnet configured using Setup Screen | View | Configure Subnets. Available in LoggerNet Admin Only |
|
|
Allows you to choose to view all devices or stations only. |
|
|
Toggles the schedule for the selected datalogger on or off. |
|
|
Resets the collection state and error statistics for the selected device. |
|
|
Initiates data collection for the selected datalogger. |
|
|
Stops a data collection attempt in progress. |
|
|
Opens the LogTool application for analyzing communication messages between the LoggerNet server and datalogger network. |
|
|
Opens a Comm Test window. |


Pause Schedule - Select this check box to pause data collection schedules for all devices in the network.
NOTE: Selecting Pause Schedule affects scheduled data collection from all dataloggers, as well as data collection via data advise in an RF-TD datalogger network and the collection of holes.
Server Time - Indicates the current time of the LoggerNet server.
Free Space - Indicates the amount of free space remaining on the LoggerNet server's hard drive.
Menu Items
The menu items provide another way to access the buttons on the Status window. There are, however, additional options that are described below.
File | Select Server - Allows you to select the LoggerNet server to which the Status window should connect (available only in LoggerNet Admin/LoggerNet Remote).
Edit | Select Columns- The information displayed on the Status window can be customized. Select this menu item to display a dialog box that can be used to add or remove columns from the display. The resulting dialog box can also be accessed by right-clicking within the Status window. For additional information, see Select Columns .
Edit | Continuous Sorting - When this option is enabled and a column is selected as the sort option for the stations displayed in the status window, the list of stations will be sorted continuously based on that column. This option is enabled by selecting it from the menu. A check box will appear to the left of the menu item when enabled. It is disabled by selecting the menu item a second time (available only in LoggerNet Admin/LoggerNet Remote).
View Menu - The View menu is used to turn on or off some of the graphical components of the Status window. An item can be toggled on or off by selecting the menu item. If a check appears beside the menu item name, the associated image will be displayed.
Comm Status Images - The Comm Status Images are the icons that show up to the left of the device name (![]()
![]()
![]()
![]() ), indicating the state of communication.
), indicating the state of communication.
Trouble Indicator - The Trouble Indicator is an exclamation point in a yellow circle that appears to the left of the device name ( ). If a communication problem occurs with a device, this indicator will appear before the text Network Map in the Network Map column and beside the device experiencing the problem.
Communication History - The Communication History  is a chart that is placed to the right of the device name. This graph shows the state of the communication link with the device over the previous 24 hour period. The colors of bar for the chart indicate whether communication was Normal, Marginal, Critical, or unknown.
Collection Image - When this option is enabled and datalogger is being dialed or is on-line for data collection, a green right-pointing triangle will be displayed to the left of the station name in the network map. If data collection with a station is pending (it is in the queue while data collection is occurring with another station), a blue right-pointing triangle will be displayed.
Tools | Terminal Emulator - Opens the Terminal Emulator, which allows you to communicate with a device in remote terminal mode.
Tools | Pool Statistics - Opens a new window displaying overall error rate, availability, percent used, and current target for all pooled devices. For more information see Pool Statistics.
Tools | Pool Devices- Opens a new window that offers information about each pool (root device) and each pooled device that has been assigned to it. For more information see Pool Devices .
Tools | State of Operations - Opens a new window displaying a list of operations currently being tracked by the LoggerNet server. For more information see State of Operations.