LogTool
The LogTool utility allows you to view the communication packets transferred between the computer running the datalogger support software and other devices in the network. These logs can be used for troubleshooting communication problems. Four logs are available:
Transaction Log (tran$.log) - This log includes information on the transactions that occur between the datalogger support software and devices in the datalogger network. Examples of these types of events are clock checks/sets, program downloads, and data collection.
Communication Log (comms$.log) - This log records information on the quality of communications in the datalogger network. Three types of messages are recorded: status messages (shown in black), warning messages (shown in blue), and failure messages (shown in red).
Object State Log (state$.log) - This log is used for troubleshooting an object in the datalogger network. The information in this log conveys the state of an object at a given time.
Low Level I/O Log (io$SerialPort_1) - This log displays low level incoming and outgoing communications for a root device (i.e., serial port).
These logs can be saved to a file by selecting Options | Log File Settings from the LogTool menu. (For additional information, see Log File Settings.) The log messages currently being displayed can be saved to a text file by selecting File | Save Log Windows to File. The log messages currently being displayed can be printed by selecting File | Print Log Windows.
When the LogTool is first opened, two logs are displayed: the transaction log and the communication log. The Object State log and the Low Level I/O log can be displayed by toggling their associated button on the toolbar. Refer to the diagram below for information on these and other functions available from the toolbar. Note that most of these functions are also available from the View menu.
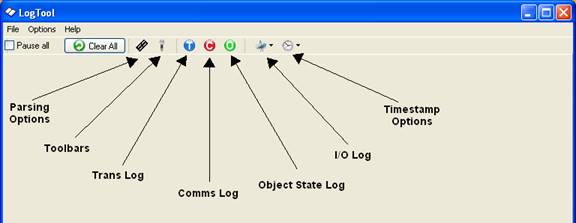
Parsing Options - Toggles the display of the Message Parsing Window.
Toolbars - Toggles the display of an individual tool bar for each of the logs. You can pause the display of messages for a tool bar by selecting the Pause check box. You can clear all messages for a log by pressing the  button. For the Communication Log, you can also choose what type of messages to show (failure, warning, and/or status) by pressing the
  button.
Trans Log - Toggles the display of the Transaction log.
Comms Log - Toggles the display of the Communication log.
Object State Log - Toggles the display of the Object State log.
I/O Log - Opens the Low Level I/O log for a specific COM port in a new window.
TimeStamp Options - Allows you to select the format for the time stamp in the logs. If none of the options are enabled (an option is enabled if a check mark appears to the left of the option name), only the time is displayed (hh:mm:ss AM/PM). If Date is selected, a date (MM/DD/YY) will be added to the time stamp. If Military is selected, the time stamp will be displayed in 24 hour format instead of 12 hour format. If ms Resolution is chosen, the time stamp will also include milliseconds.