TroubleShooter
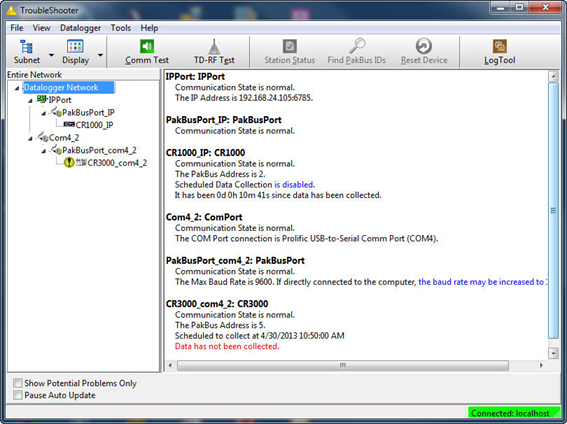
The TroubleShooter is a tool that can be used to help assess communication problems in a datalogger network. When the TroubleShooter is opened, all communication ports, peripheral communication devices, and dataloggers that have been set up in LoggerNet will be displayed on the left side of the window.
To review the current known state of devices in the network, use your mouse to highlight the Datalogger Network (to see all devices) or highlight only one device (to see the status of all devices required to reach that device). On the right side of the window, status information is displayed. Note that the information is not updated until communication is attempted with the datalogger (either manually from the Connect window or automatically based on scheduled data collection).
The information will be different for each device, but may include the type of device, the device name in the network map, the state of communication with the device, whether or not scheduled data collection is enabled, whether or not table definitions are valid, modem type, phone number, device address, and the error rate.
Much of the status information is self-explanatory. Some information which may require further definition follows.
Communication State - Communication State will be listed as Unknown until communication is attempted with a device. Once a communication attempt has been initiated, it will be listed as Normal (communication is successful), Marginal (there are some errors in communication, but none that cannot be recovered from), or Critical (communication failed).
Scheduled Data Collection- This is the automatic data collection schedule. The state is either enabled, disabled, or paused. Scheduled data collection is paused from the Status window (Pause schedule check box).
Table Definitions- Table-based dataloggers return information on all the data tables in the datalogger to the LoggerNet server. The state can be Valid or Out of Date. If table definitions are out of date, they must be updated before data can be collected from the datalogger (LoggerNet attempts to do this automatically. Table definitions can be updated manually from the Setup window's Data File tab for the datalogger.)
Avg Error Rate- A running average, expressed in percent, of the number of communication failures and retries over a period of time.
Buttons
Subnet - Allows you to choose to view the entire network or a subnet configured using Setup Screen | View | Configure Subnets. Available in LoggerNet Admin Only
Display - Allows you to choose to view all devices or stations only.
Comm Test - Pressing the Comm Test button will open the Communication Test window. From this window you can test the communication link for one or more dataloggers in the network map. For additional information, see Comm Test.
TD-RF Test - This option opens a window from which you can perform a communications test on a table data RF modem link (RFBase-TD, RFRemote-TD, or RFRemote-PB). This test is not applicable for RF400 radios or non-TD based RF modems. See Tools | TD-RF Test for additional information.
Station Status - Highlight a datalogger from the list on the left and press the Station Status button to display the station status information from the datalogger. For additional information on Station Status, see Station Status.
Find PakBus IDs - This option is used to find PakBus devices attached to a PakBus port within the communication network. Highlight a PakBusPort from the list on the left and press the Find PakBus IDs button. LoggerNet will initiate a search for all PakBus devices on that particular PakBus Port. (It may take a few moments to return a response.) If the PakBus ports are bridged, the IDs for all PakBus devices found will be returned.
Reset Device - Resets the statistics and collection schedule for the selected device.
Log Tool - Pressing the Log Tool button opens the Log Tool application. For additional information on Log Tool, see LogTool.
Check Boxes
Show Potential Problems Only - This check box is used to filter out all messages but ones that may point to a communication problem.
Show Stations Only - This check box is used to show status information for only the dataloggers in the TroubleShooter window.
Pause Auto Updates - This check box is used to pause automatic updates to the status information. This option is generally only useful when viewing an entire large network. This is because with a large network, not all status information is visible on the screen, and a scroll bar will be used to scroll through the information. Automatic updates always end with the scroll bar at the bottom of the screen, which can cause difficulty in reading the information at the top of the screen.
Menu Items
Many of the menu items provide an alternate way of accessing the functions that can be launched by the buttons or check boxes on the main window of the TroubleShooter. Other menu items are as follows:
File | Save Analysis to File or Print Analysis - Saves or prints the information shown on the right side of the TroubleShooter window. If the Datalogger Network is selected, information for all devices will be printed or saved. If only one device is selected, only information for that device is printed or saved.
View | Customize Network Checks - Use this option to select the items for which warnings are to be given. When the Select All check box is marked, all warnings will be given. For only specified warnings to be given, clear the Select All check box and then manually select those warnings you wish to see.
View | Show Hints - When this option is selected, popup hints will be displayed for a button if the mouse cursor hovers over the button for a few seconds. When the option is not selected, no popup hints will be displayed.
Datalogger | Update Table Definitions - This option is used only for table-based dataloggers.
Table definitions provide information on the number of tables in the datalogger, the size of the tables, and the data values they contain. The LoggerNet server uses this information when creating the data cache for the datalogger. If the table definitions in the datalogger are different than the information that LoggerNet has stored, data collection may be disabled. When this menu item is selected, LoggerNet will update its information with table definition information from the highlighted datalogger.
Datalogger | Reset to Factory Defaults (Hardware Reset) - This option is used only for mixed array dataloggers with a default operating system.
This option should be used with extreme caution. It should be performed across a direct COM port connection. It will perform a full hardware reset of the datalogger. All memory will be erased including any data and programs. The datalogger will be returned to its factory defaults. The communication link will be lost and the datalogger will do a full memory test. Communication should not be attempted with the datalogger until after the memory test is complete. The time required for this memory test is as follows:
|
Datalogger |
Time |
|
CR10X |
35 seconds |
|
CR10X-2M |
8 minutes |
|
CR510 |
35 seconds |
|
CR510-2M |
8 minutes |
|
CR23X |
8 minutes |
|
CR23X-4M |
16 minutes |
Tools | Terminal Emulator - Opens LoggerNet's Terminal Emulator.