Station Status
Information about the datalogger program, the execution of the program, battery voltage, internal temperature, etc. can be viewed from the Datalogger | Station Status menu item.
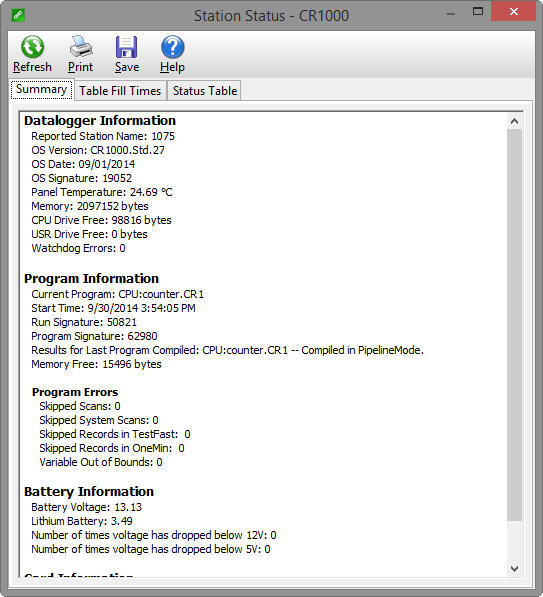
The window has three tabs. The Summary tab provides an overview of important status information in the datalogger, including the information about the datalogger model and its firmware, program details,
NOTE: Only the Summary tab is available for array-based dataloggers.
The Table Fill Times tab lists the tables in the datalogger, along with the maximum number of records the table can hold, and the estimated amount of time that it will take the table to fill. A data table can be reset from this window by pressing the Reset Tables button.
NOTE: For extended-memory dataloggers, auto-allocated data tables are automatically written to the extended internal memory (which is 72 MB), unless CardOut() or Tablefile() is used. In the case of CardOut() or Tablefile(), data from the CPU is streamed to the card in 1 KB frames and the internal extended memory is not used. Therefore, on extended-memory dataloggers, table fill times for auto-allocated tables on the CPU are greater if CardOut() or Tablefile() is not used. However, note that total final data storage for the table is greatly extended with external memory (up to 2 GB per table). In order to tell if the datalogger has extended internal memory, view the datalogger CPU Bytes Free in File Control. Dataloggers with extended internal memory show 30 MB Bytes Free for an empty CPU, compared to 1 MB Bytes Free for dataloggers that do not have extended internal memory.
NOTE: No Table Fill Time statistics will be shown for a CR200 Series datalogger, because they cannot be calculated for this datalogger model.
NOTE: For the CR10XTD, CR10XPB, CR510TD, CR510PB, CR23XTD, and CR23XPB, the Time of Fill will not be shown and you will not have the option to Reset Tables.
NOTE: Resetting a table will erase the data in the datalogger and in the data cache.
The Status Table tab lists all of the Status Table fields in the datalogger along with their values. By default, all of the fields in the Status Table are displayed. To select only certain status data to be viewed, press the Select Fields button. This will display a list of the status data available in the datalogger. Select one or more of the fields and then press OK. The current values will be displayed in the table. If you select a cell within the Status Table and right click, a short cut menu will be displayed. From this menu you can select fields or view/modify a value (if it is a writable value).
Refer to individual datalogger manuals for a list of fields included in the Status Table and a description of each field.
Press the Refresh button to prompt LoggerNet to query the datalogger and update the values again, the Print button to print the information in the current tab, or the Save button to save the information in the tab being displayed to a file. (Note that you cannot save or print the information on the Table Fill Times tab.)
