Measurements
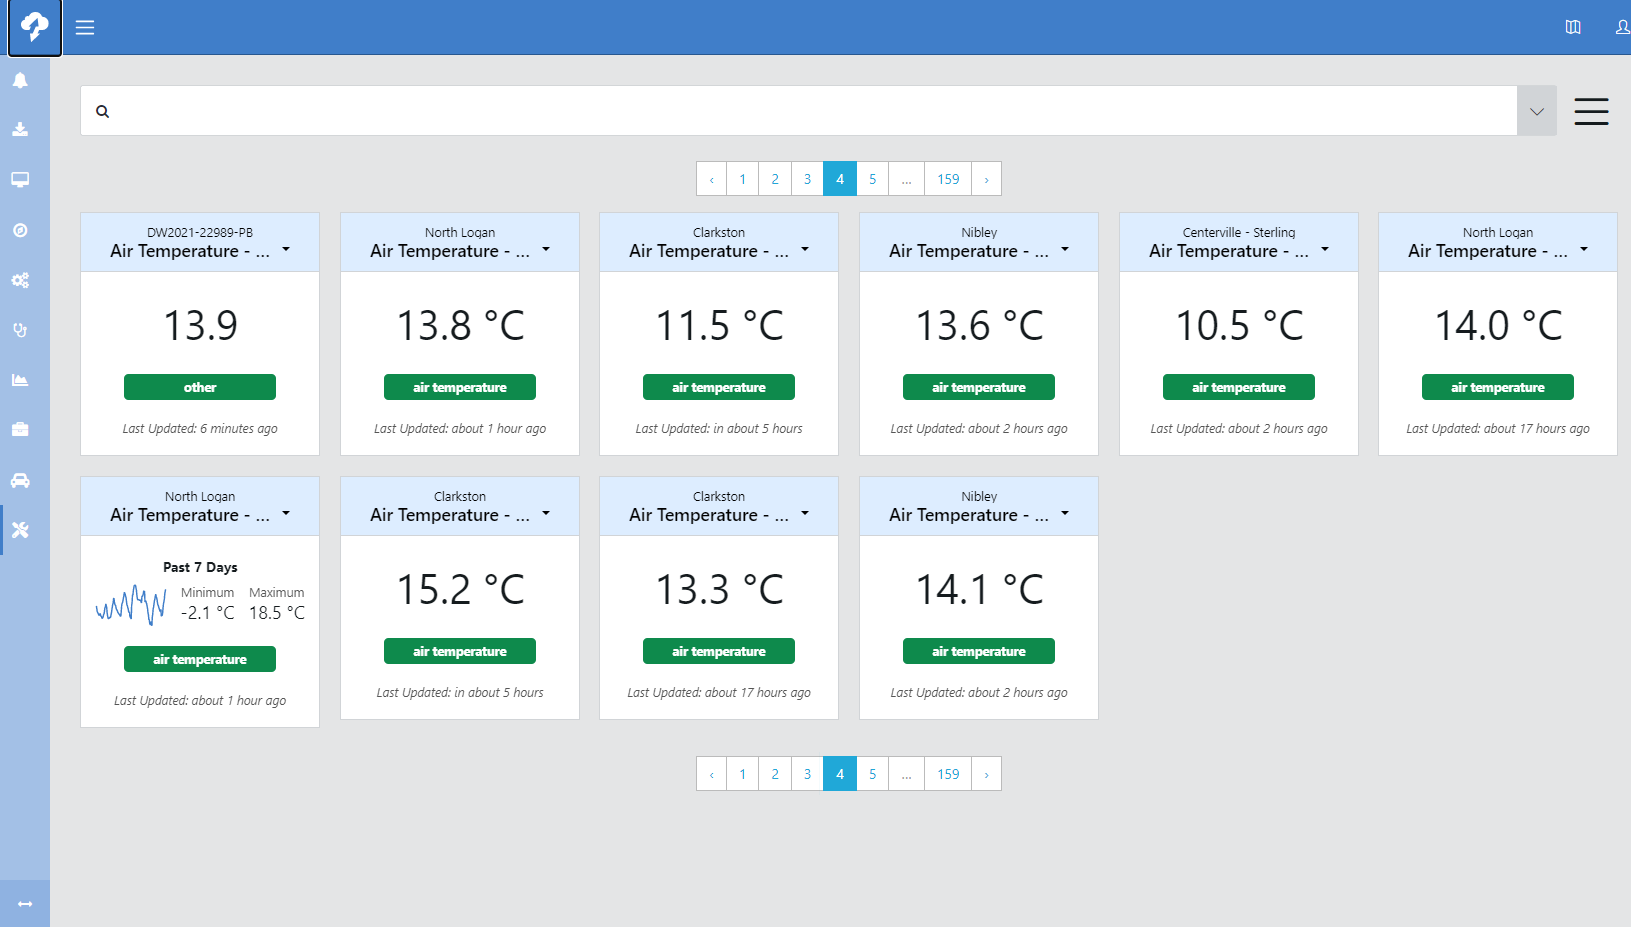
Use Measurements to see and configure settings for all measurements from all the stations in the network.
There is a lot of information available on this page. Configuration is the key to make it easy to use.
Click  at the upper right to select:
-
sort criteria: measurement name a to z or measurement name z to a
-
page size: How many measurements are shown per page.
-
more options:
-
toggle measurement types: Determines whether or not measurement types are displayed on tiles.
-
toggle measurement aliases: Determines whether or nor measurement aliases are displayed on tiles.
-
Use the drop-down next to the search box at the top of the screen to show station names, measurement names, measurement aliases, labels, measurement types, measurement units, or computed vs standard values. Select an option to show only stations and/or measurements that match that option. Each option selected narrows the list of values shown. Type into the search box to narrow the lists of options based on what is typed.

The following options are available using the drop-down menu on each tile.
When navigating between tabs on the side pane, always make sure to click  before navigating to a different tab. Otherwise, your changes will be lost.
Scroll through the pre-configured options to select the tile to display for the measurement. Click  to save your selection.
Measurement Metadata 
The station and raw measurement name from the data logger program are shown at the top. Specify the:
-
Alias: Alternate name for the measurement.
-
Display Precision: Number of decimal places to display.
-
Date Type: Numeric, Text, or Array.
-
Data Aggregation: Average, Sum, Minimum, or Maximum.
-
Unit: Units of measurement for the measurement.
-
Type of Measurement: This option only appears after a Unit has been set for the measurement. When a type is set, it will be displayed in a green box on measurement tile.
-
Focused Measurement: Whether or not the measurement is displayed on station tile.
Click  to save your selection.
QA Rules 
CAMPBELL CLOUD has a QA engine that tests all ingested data against defined rules. The initial defaults are based on NOAA recommendations. If there is a QA rule violation, an annotation will be attached to the data point to indicate that the value was flagged.
Set the Erroneous Data Threshold (minimum and maximum) or select Use Suggested Thresholds. Erroneous values are outside the range of valid possibilities. They will be excluded from normal processing.
You may also enable and set Suspect Data Threshold (minimum and maximum). Suspect values might be valid, but there is reason to believe that they may not be (for example, the sensor specifications). They will be returned, but flagged as suspect.
Select (or enter) an Error Code that the measurement will be flagged with. This can be used to record an error code sent by the sensor.
QA Rules are used in the CAMPBELL CLOUD user interface and API only. They do not apply to Custom Export.
Click  to save your selection.
Change Tile 
Scroll through the pre-configured options to select the tile to display for the measurement. Click  to save your selection.
Displays the measurement in Network Health.
Displays the station in the default view of View > Network.
Displays the measurement in Explore.
Adding a computed value
Click Add a computed value.
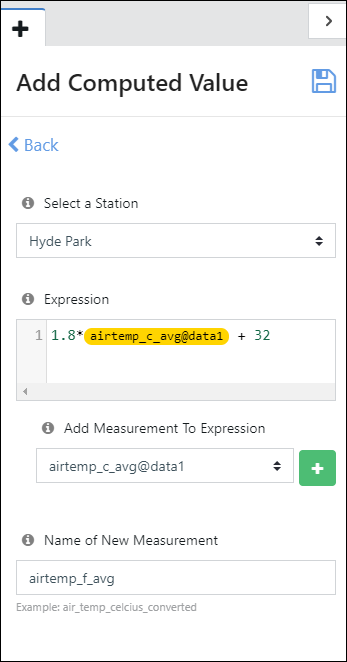
Select whether the computed value will be a Calculated Value (for example, to change units of measure) or Text from Value (for example, converting wind direction degrees to a text direction).
For a Calculated Value:
-
Select the station.
-
Type the calculation in the Expression field. When you need to add a measurement to the expression, select the measurement under Add measurement to expression and click
 . CAUTION:
The syntax for expressions must follow the form of
A operator (B*(expression))
to be evaluated correctly.
For example, the expression
100 - 5(A - B)
always returns a computed value of 100. The 5(A-B) is not calculated correctly and it is ignored.
When the same expression is written as
100 - (5*(A-B))
a correct computed value is returned.
For Example:
100 - 5(22 - 18) = 100
100 - (5*(22-18)) = 80
These expressions are supported in computed values:
-
min(MEASUREMENT, window="fixed", range="1h")
-
max(MEASUREMENT, window="fixed", range="1h")
-
mean(MEASUREMENT, window="fixed", range="1h")
-
sum(MEASUREMENT, window="fixed", range="1h")
-
count(MEASUREMENT, window="fixed", range="1h")
-
median(MEASUREMENT, window="fixed", range="1h")
-
std(MEASUREMENT, window="fixed", range="1h")
-
last(MEASUREMENT, window="fixed", range="1h")
-
rateofchange(MEASUREMENT, window="fixed", range="1h")
*1 is used only as an example; any whole number can be used.
The window can be fixed or rolling.
The supported ranges are:
-
millisecond: 10ms
-
second: 10s
-
minute: 10m
-
hour: 10h
-
day: 10d
-
week: 10w
-
year: 10y
*10 is used only as an example; any whole number can be used.
-
-
Enter a Name of New Measurement.
-
Click
 .
.
For a Text from Value:
-
Select the station and measurement.
-
Select an Exact Match or Range.
-
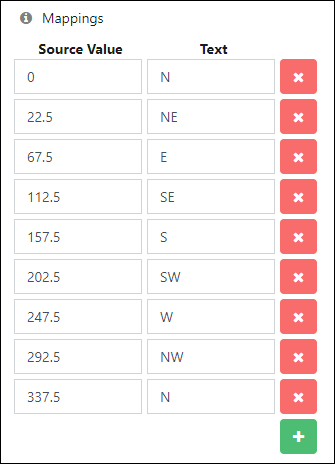
Specify the Mappings by entering a Source Value and Text for each value (or range).
For example, to map wind degrees to text direction, enter this:

-
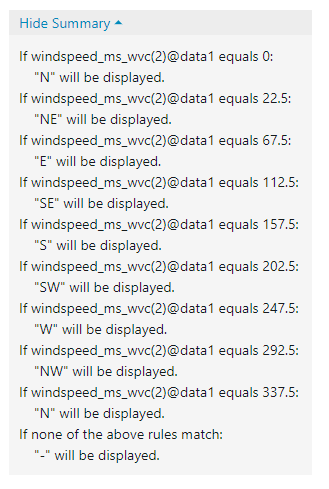
Click View Summary to see a summary of the value to text mapping:

-
Enter a Name of New Measurement.
-
Click
 .
.