Explore
Use Explore to create custom graphs with different measurements together from different stations.
If you navigate to Explore directly from View > Measurement, a graph of that measurement will be displayed. Otherwise, click click here to get started.
Each time you return to Explore, settings are returned to their defaults. Create a Dashboard for graph configurations that you want to view repeatedly.
Use the drop-down next to the search box at the top of the screen to show station measurements, measurement labels, measurement types, or measurement units. Select an option to show only measurements that match that option. Type into the search box to narrow the lists of options based on what is typed. After making search selections, click on the page in the background to close the search options.
All measurements that match the search criteria will be added to the graph, up to a maximum of 20.
Click ![]() at the upper right to select whether to display measurement aliases (rather than measurement names) in the graph legend and pop-ups.
at the upper right to select whether to display measurement aliases (rather than measurement names) in the graph legend and pop-ups.
Hover over the graph to display a pop-up with timestamps and data values at the mouse position.
Click on a trace in the legend at the bottom of the graph to toggle that trace on and off.
Use the bar at the bottom of the graph to zoom. Drag an end of the bar to determine the width of the data being displayed. Next, drag the bar to scroll through the zoomed data.
Data displayed on the graph is aggregated to reduce the data that needs to load for long time ranges. The longer the date range being displayed, the less frequent the data will be that is displayed. See Data aggregation.
The following options are available using the drop-down menu next to Explore. Selecting an option will open a side pane on the right side. In addition to using the drop-down menu, you can navigate between these options with tabs at the top of the side pane. After selecting any options, click  to have the selections applied to the graph.

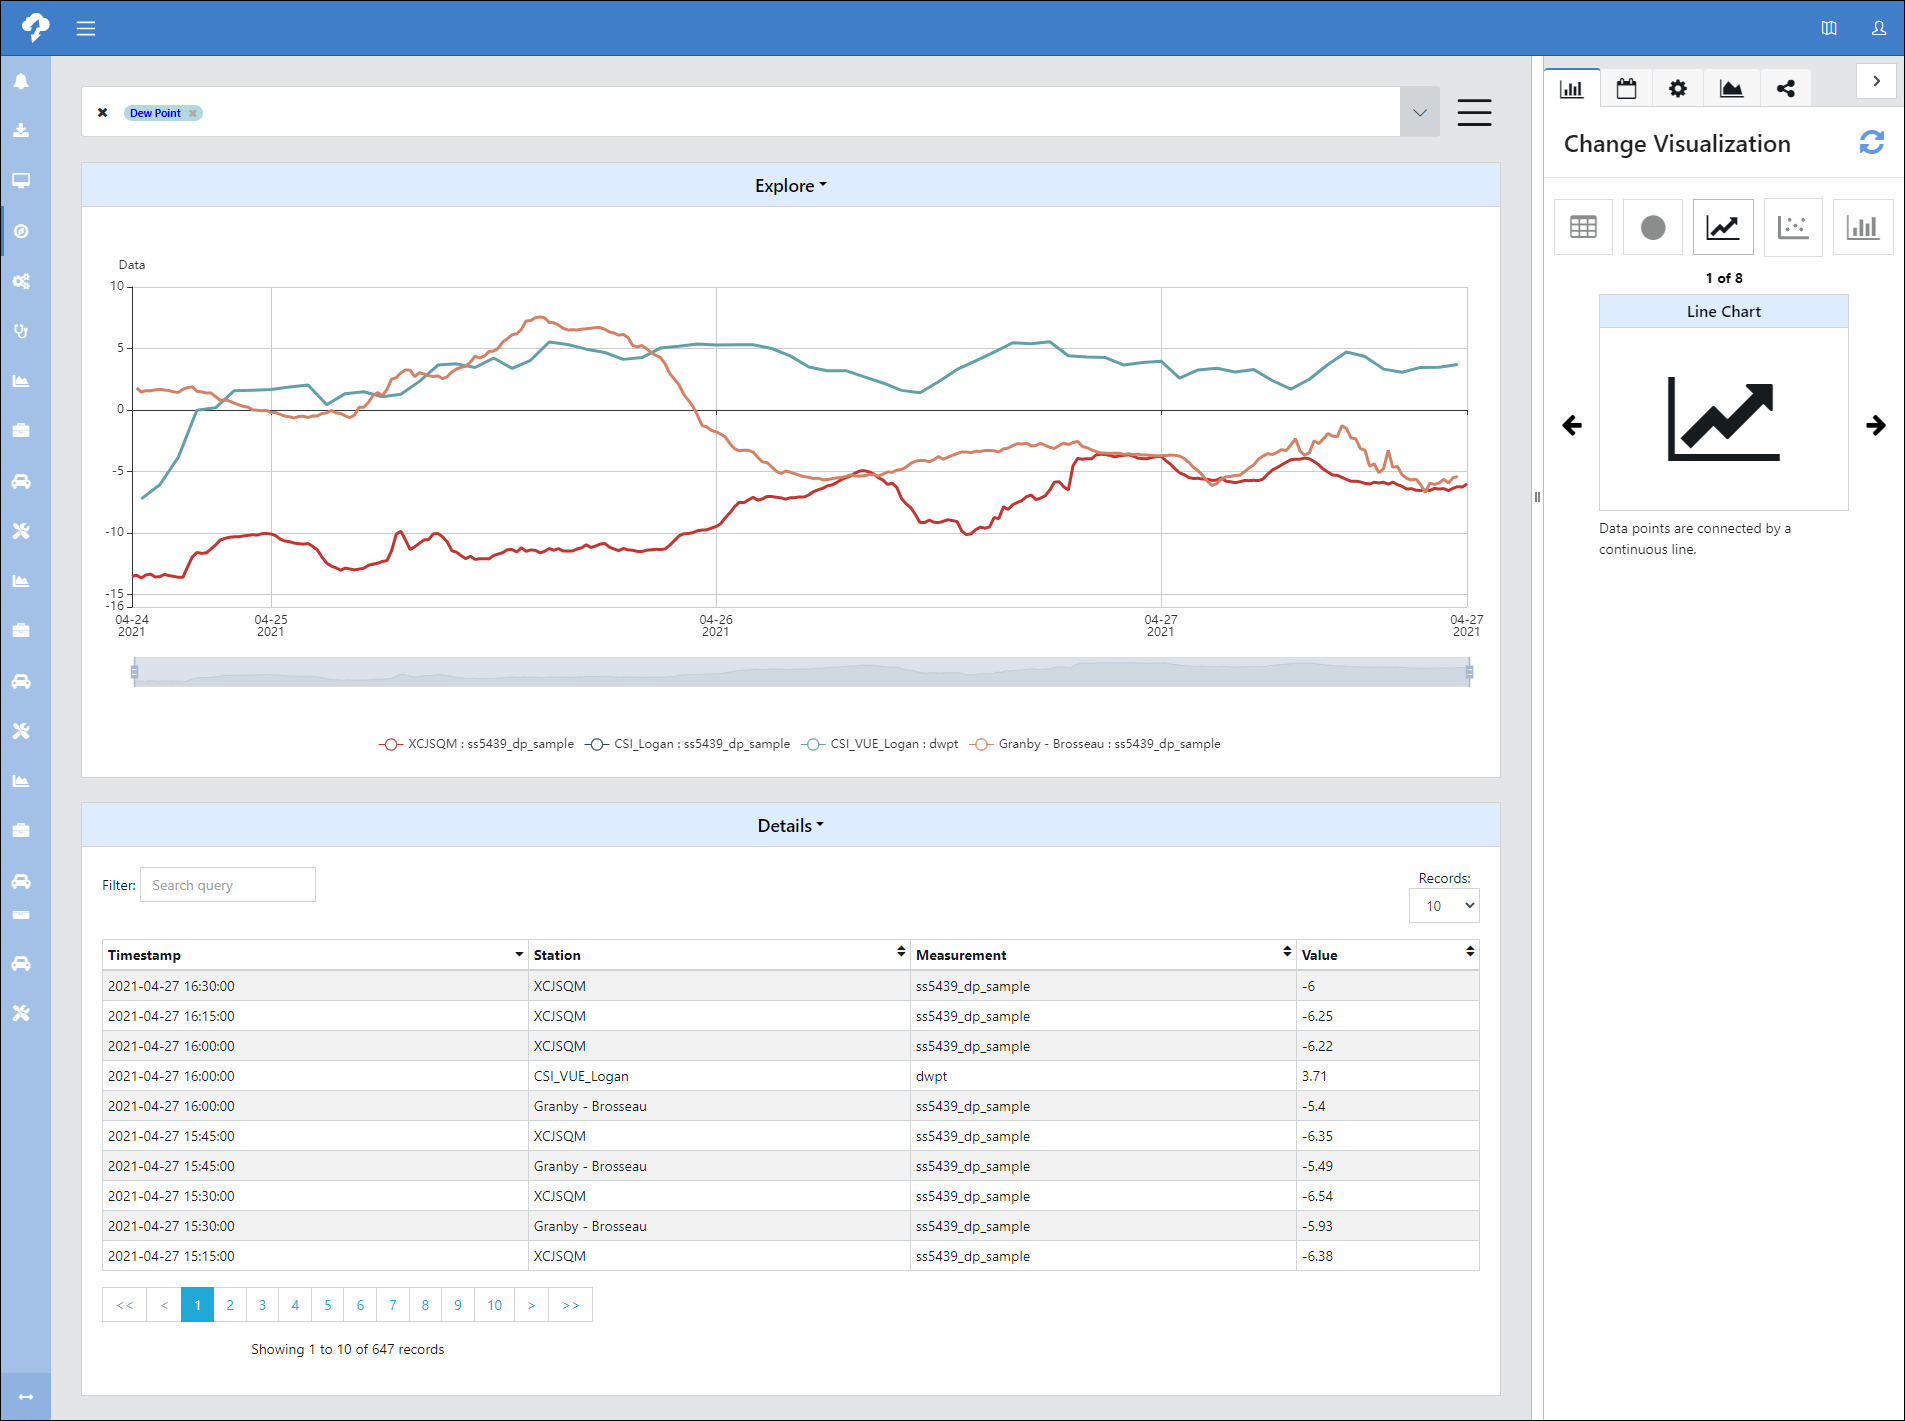
Scroll through the options to select the graph type:
-
Line Graph: Data points are connected by a continuous line.
-
Scatter Chart: Each data point is shown with a single dot.
-
Vertical Bar Chart: Each data point is represented by a vertical bar. The height of the bar represents the value.
-
Horizontal Bar Chart: Each data point is represented by a horizontal bar. The length of the bar represents the value.
-
Depth Chart: Plots measurements against depth, with each series manually allocated a depth (in Series Options
 ). Typically this is used for soil profile measurements, and shows the latest value in the time range at each depth with the temperature on the x-axis and the depth on the y-axis.
 -
Gauge: Display values on a single gauge. The min/max can be changed in Visualization Options.
-
Table: A tabular view of the data.
-
Indicator: Display a single colored circle based on the value of the measurement. The thresholds for each color can be set in the Visualization Options.

Select the range of data to be displayed. Enter a number and select Minutes, Hours, Days, or Months to select a date range relative to the current time. Select Exact Date Range to bring up a calendar to select exact start/end dates and times.
These options vary based on visualization type. Typical options include:
-
Color
-
Size
-
Line Style: Solid, Dashed, or Dotted
-
Show in Legend
-
Axis: Left or Right
-
Label: Enter a label to replace the measurement name (or alias) displayed in the legend and pop-ups.
-
Numeric Depth: For Depth Chart visualizations, indicate the depth of each sensor.

These options vary based on visualization type. Typical options include:
Display
-
Title: Enter a title to be displayed at the top of the graph.
-
Subtitle: Enter a subtitle to be displayed under the title.
-
Show Legend: Select whether or not a legend is displayed on the graph.
-
Scrollable Legend: Select whether or not the legend is scrollable. A scrollable legend will allow you to scroll through data values. If the legend is not scrollable, the entire legend will displayed on the graph.
-
Toggle change over time: For Depth Chart, adds lines to the graph that show the maximum and minimum values of the measurement in the period of time selected.
Left/Right Axis
-
Show: Select whether or not the axis will be shown on graph.
-
Min: Enter the minimum value for the axis. If nothing is entered the graph will be auto-scaled according to data values.
-
Max: Enter the maximum value for the axis. If nothing is entered the graph will be auto-scaled according to data values.
-
Label: Enter a label for the axis.
-
Align Label: Select whether to align the label at the Top of the axis or the Center of the axis.
X Axis
-
Show: Select whether or not the axis will be shown on graph.
Threshold Lines
-
Click Add Line to add a dotted threshold line to the graph.
-
Value: Enter the value for the threshold line.
-
Color: Select the color for the threshold line.
-
Size: Enter the size of the threshold line.
-
Click Delete Line to delete the threshold line.
-

Download the data contained in the graph as a CSV or PNG. Enter a File Name for the download.
This downloads the data loaded to create the graph, that is, the aggregate data. See Data aggregation. Use Custom Export to export the raw data.
Details
Use the drop-down menu next to Details to select expand tile. This displays the data contained in the graph in a tabular format.
Type in the Filter box to filter on a Station, Measurement, or Value. Click on any column heading to sort on that column. Click again to toggle ascending/descending order.
With the tile expanded, use the drop-down menu next to Details to select download CSV. This downloads the table data into a CSV file.