Dashboard
Use Dashboard to create your own graphical displays of CAMPBELL CLOUD data.
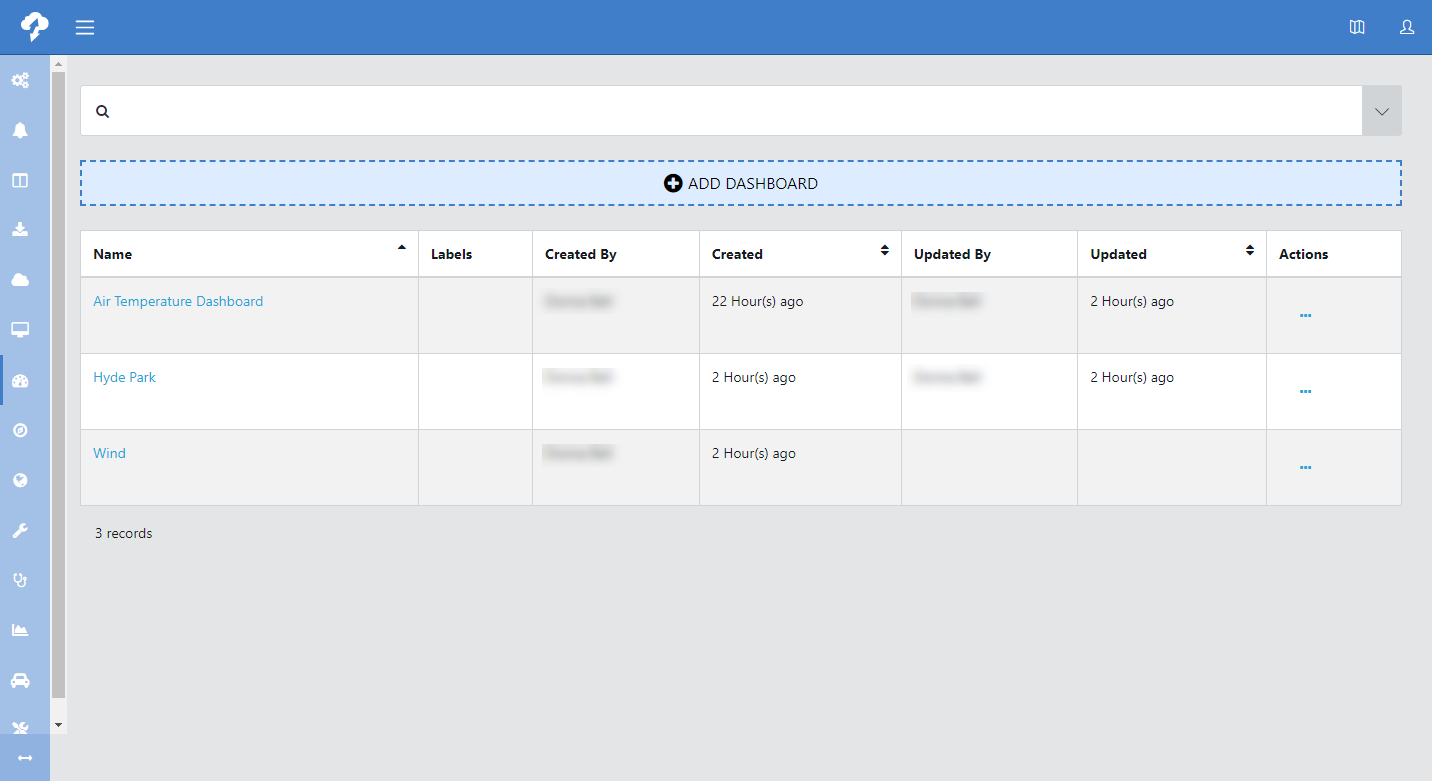
The main Dashboard screen shows all of your dashboards. Click on the Name, Created, or Updated column heading to sort on that column. Click again to toggle ascending/descending order.
Use the drop-down next to the search box at the top of the screen to show dashboard names, created by, updated by, and labels. Select an option to show only dashboards that match that option. Type into the search box to narrow the lists based on what is typed.
Click a dashboard name to open the dashboard. Click the ellipsis under Actions to edit or delete a dashboard.
Creating a new dashboard
A  next to a dashboard name indicates unsaved changed. The changes will be lost if you navigate away from the dashboard without first saving.
-
Press Add Dashboard. The new dashboard starts with one panel.
-
Use the lower-right corner to drag the panel to the desired size. Click in the panel title bar and drag to position the panel in the dashboard window.
-
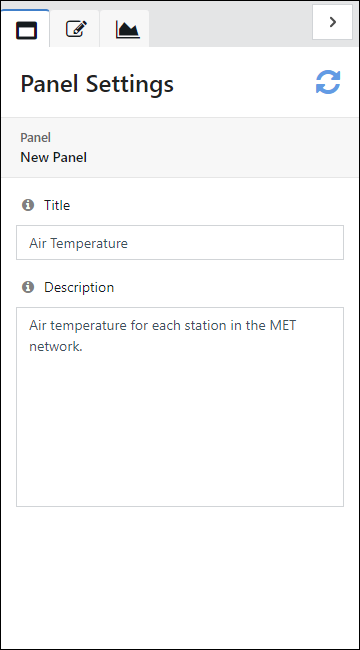
Use the drop-down arrow to the right of New Panel to configure the settings for the panel.
-
Enter a Title and Description for the panel.
-
Click
 to refresh the panel in the dashboard.
 -
Click
 to set the panel data.
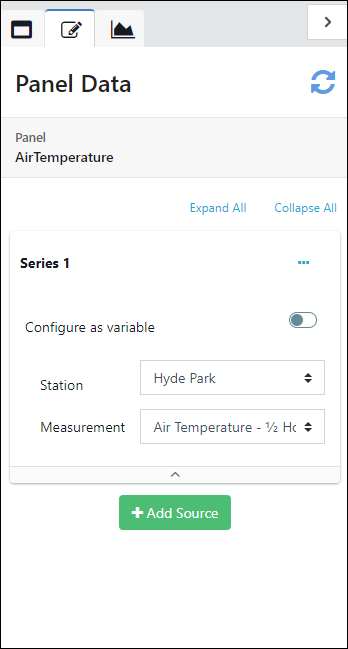
-
Click Add Source to add a data source to the panel.
-
For a constant data source, select the Station and Measurement to be used as a data source.
For a variable data source, select Configure as variable and use Filter to select the measurement types and/or units of measure to include. Press + to add multiple filters.
NOTE:For variable data sources to be used:
-
The station variable must be enabled. See Steps 17-18.
-
Measurement types and/or units must be set. See Measurement Metadata
-
-
Repeat Steps 7-8 for each data source to be displayed in the panel.
-
Click
to refresh the panel in the dashboard. -
Click
 to choose the visualization type.
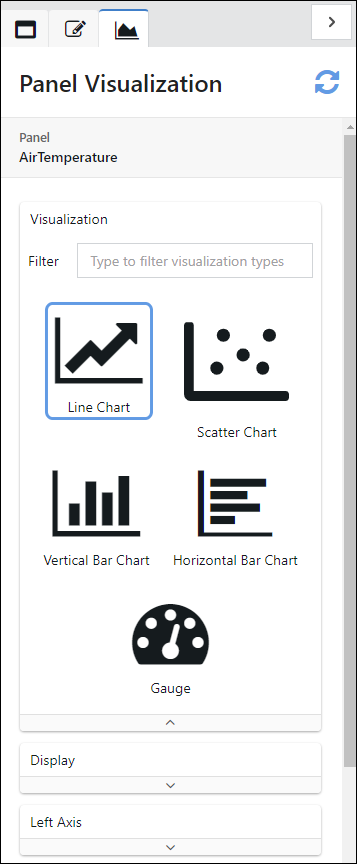
-
Scroll through the options to select the visualization type:
-
Line Chart: Data points are connected by a continuous line.
-
Scatter Chart: Each data point is shown with a single dot.
-
Vertical Bar Chart: Each data point is represented by a vertical bar. The height of the bar represents the value.
-
Horizontal Bar Chart: Each data point is represented by a horizontal bar. The length of the bar represents the value.
-
Gauge: Display values on a single gauge.
-
-
Configure the options for the visualization. These options vary based on visualization type.
-
Click
to refresh the panel in the dashboard. -
Use the drop-down arrow next to the dashboard name and select insert panel to add another panel to the dashboard.
-
Repeat steps 2-14 for each panel of your dashboard.
-
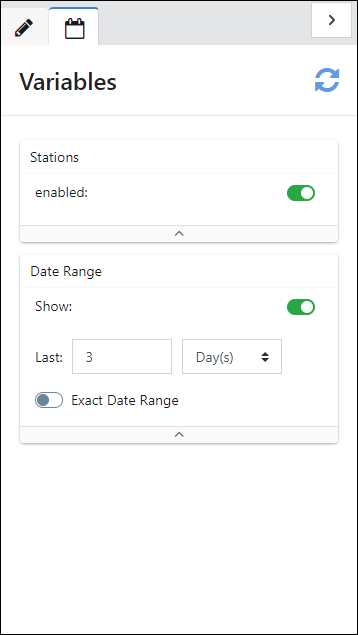
Use the drop-down arrow next to the dashboard name and select variables to modify the variables for the dashboard.
-
Enable the Stations variable to use variable data sources. This will add a Station selector to the dashboard to select which station to view data from.
-
Use the Date Range variable to switch between a relative date range or an exact date range.
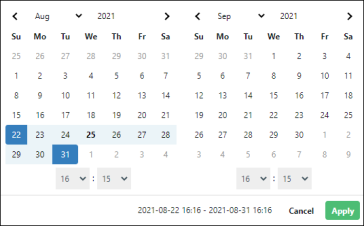
To enter an exact date range:
- Click on the calendar to indicate start and end dates.
- Specify the start time.
- Specify the end time.
- Click Apply to confirm your selection.
Select the Show option to display a Date Range selector on the dashboard. If Show is not selected, the date range will not be changeable.
-
Click
to refresh the dashboard. -
Use the drop-down arrow next to the dashboard name and select save to save the dashboard.
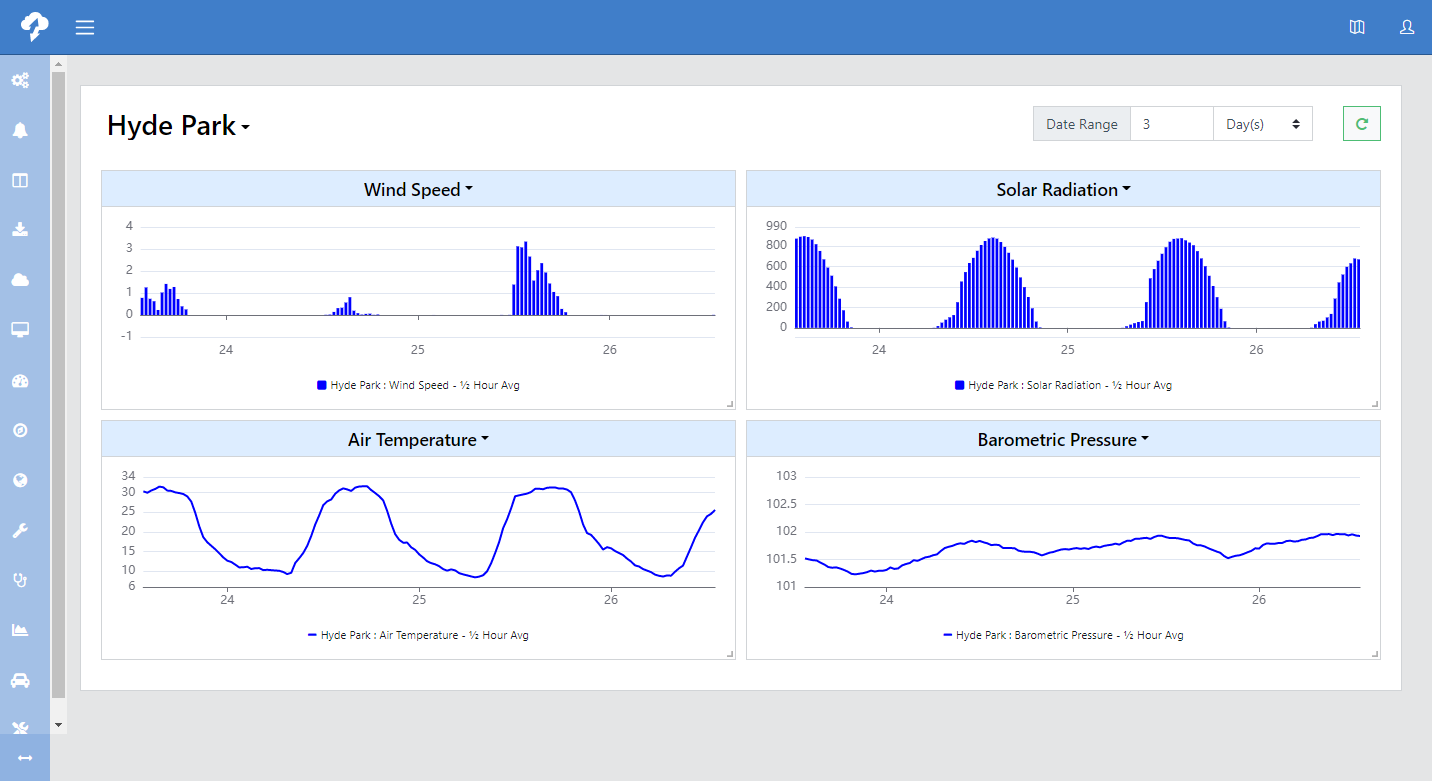
Viewing a Dashboard
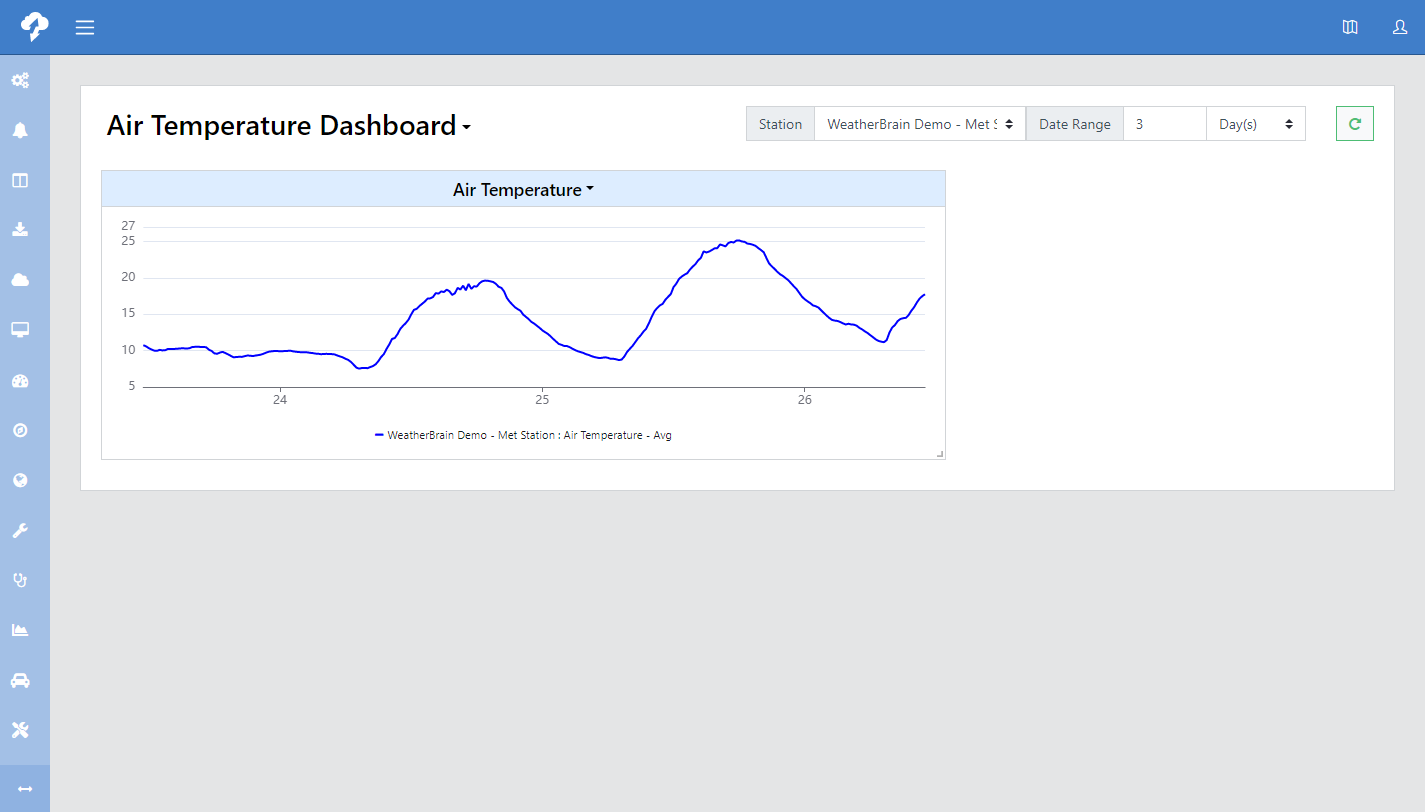
Click on a dashboard name to view the dashboard.
If the dashboard was set up with a variable station, click on the Station drop-down list to choose the station to view. If the dashboard was set up with a variable date range, use the Date Range control to select the date range. Note that the control may be set up to use a relative or an exact date range. After making your selections, click  to update the data in the dashboard.
Data displayed on the dashboard is aggregated to reduce the data that needs to load for long time ranges. The longer the date range being displayed, the less frequent the data will be that is displayed.
Editing a dashboard
Click the ellipsis under Actions and select edit (or simply click the dashboard name) to edit a dashboard.
All of the actions described in Creating a new dashboard can also be used to edit the dashboard.