Network Health
Use Network Health to see:
- If you are receiving all the data from a station.
- If you are receiving all data on time.
- If the data has any data points tagged with a QA (Quality Assurance) issue.
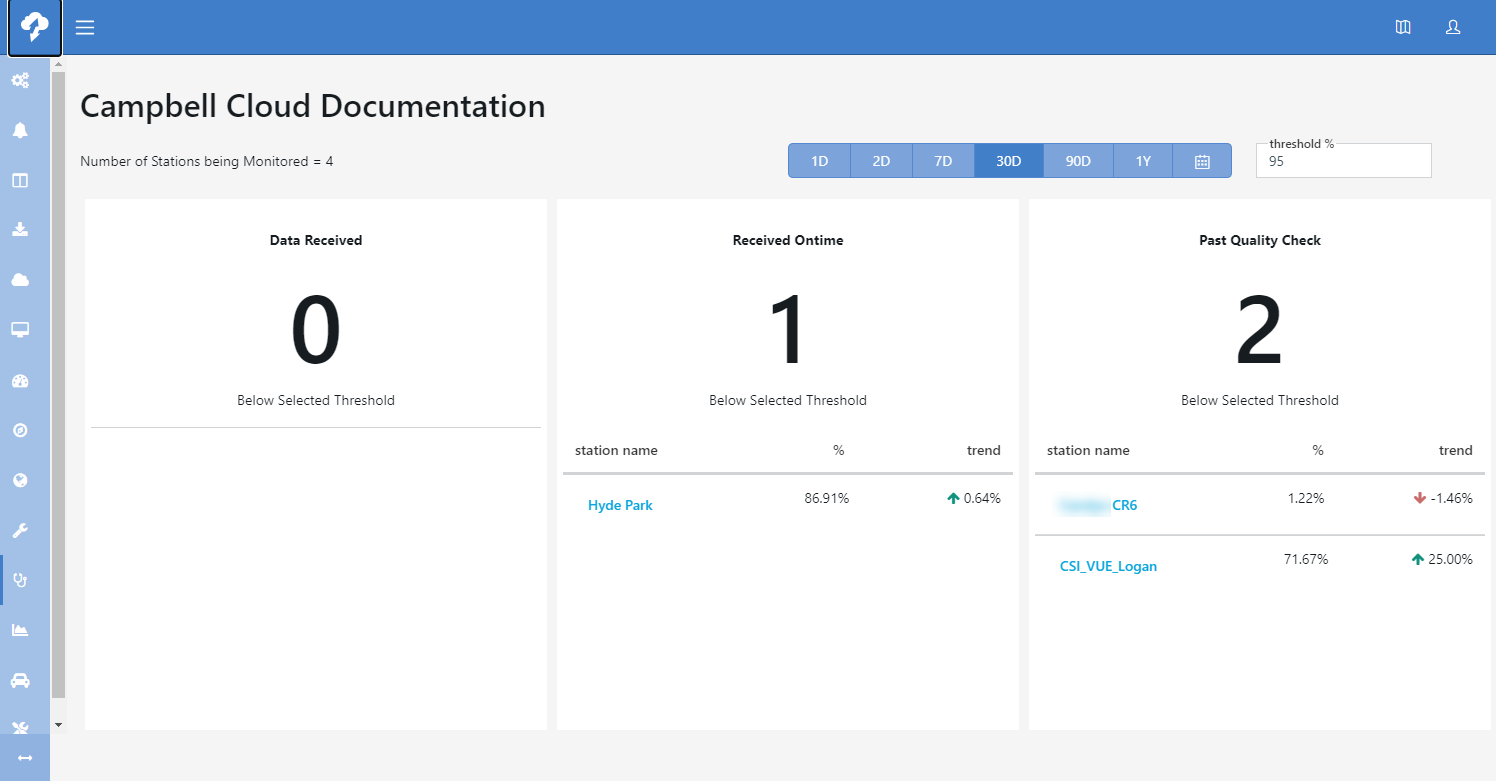
At the top, set the time period for the statistics. Select one of the predefined options, 1D (1 day), 2D (2 days), 7D (7 days) 30D (30 days), 90D (90 days), 1Y (1 year), or use the calendar button to set a custom time period. The Threshold % is used to filter the lists in the three categories. Only stations with a percentage equal to or less than the Threshold % will be shown in each column. For instance, with a threshold of 95%, if a station is receiving less than 95% of the data, that station will be shown in the display.
Setting the threshold % too high may result in a large list of stations not meeting the threshold. This can mask the stations with significant problems.
The first column shows the number of stations for which you are not receiving all data. Underneath the number, each station that is not receiving all data is listed along with the percentage of data being received, and whether that percentage is trending up or down. This helps to help identify if there are gaps in the data that has been received from the station.
The second column shows the number of stations for which you are not receiving all data on time. Underneath the number, each station that is not receiving all data on time is listed along with the percentage of data being received on time, and whether that percentage is trending up or down.
The third column shows the number of stations for which the percentage of data points without QA annotations did not meet the threshold. Underneath the number, each station that is not meeting the threshold is listed along with the percentage of data without QA annotations, and whether that percentage is trending up or down.
A data point is tagged with a QA annotation, if it violates the predefined QA rules. The rules are unique to each data value, and most often include minimum and maximum thresholds. See QA Rules .
Select a station in any list to see the availability, uptime, and quality statistics for each measurement from the station. The count for each quality issue is also shown.
Select a measurement to see availability, uptime, and quality statistics for that measurement for each day in the time period.