Data Explorer
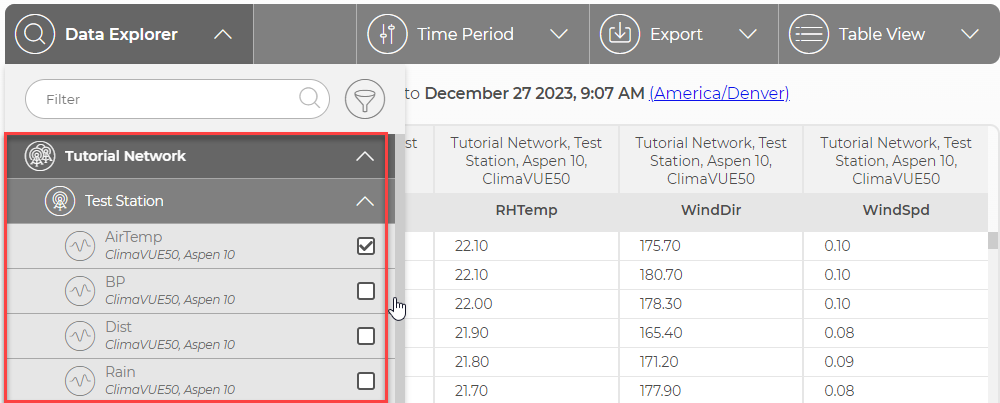
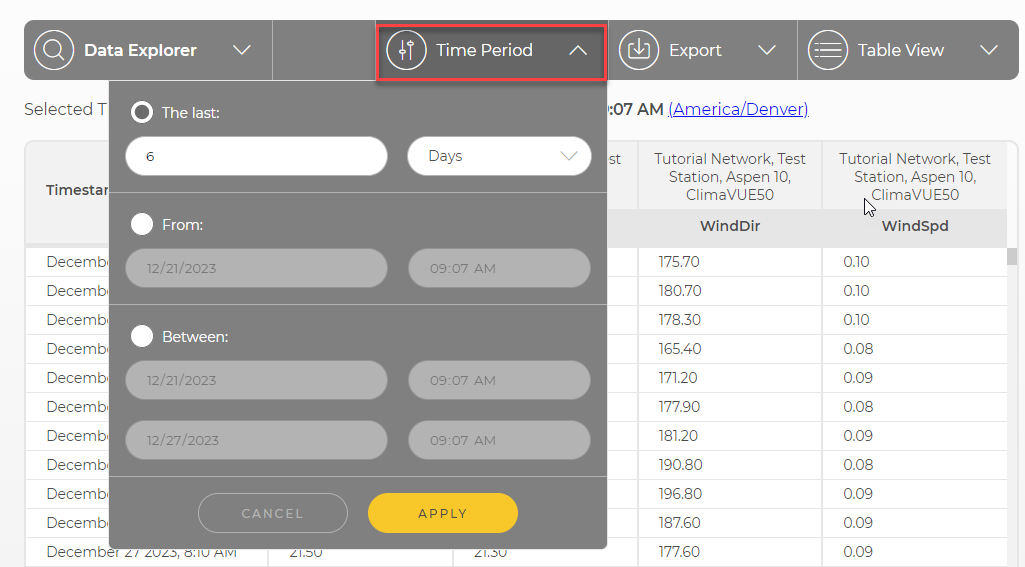
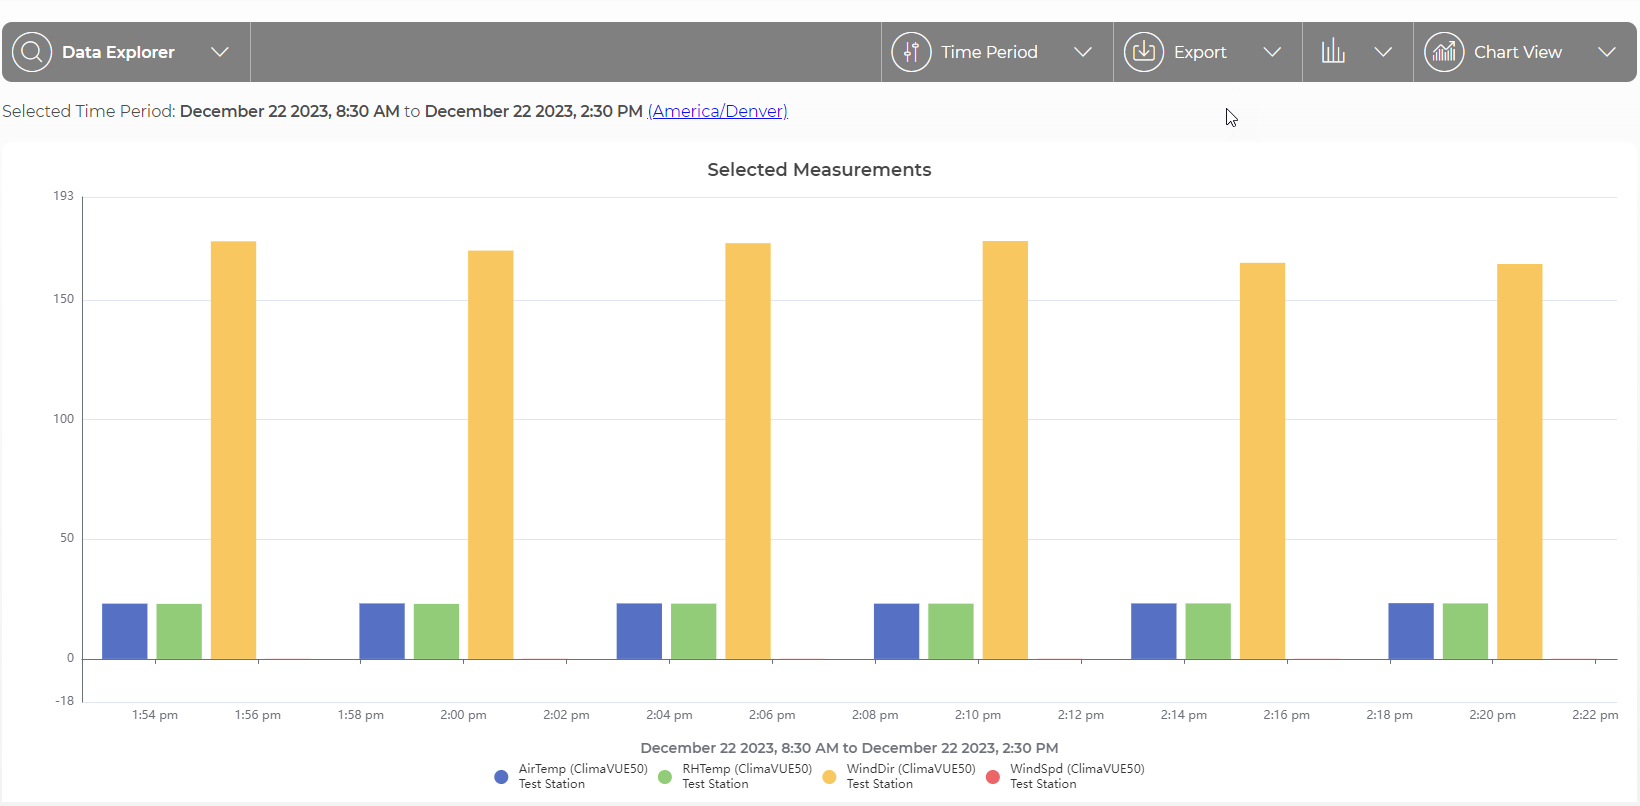
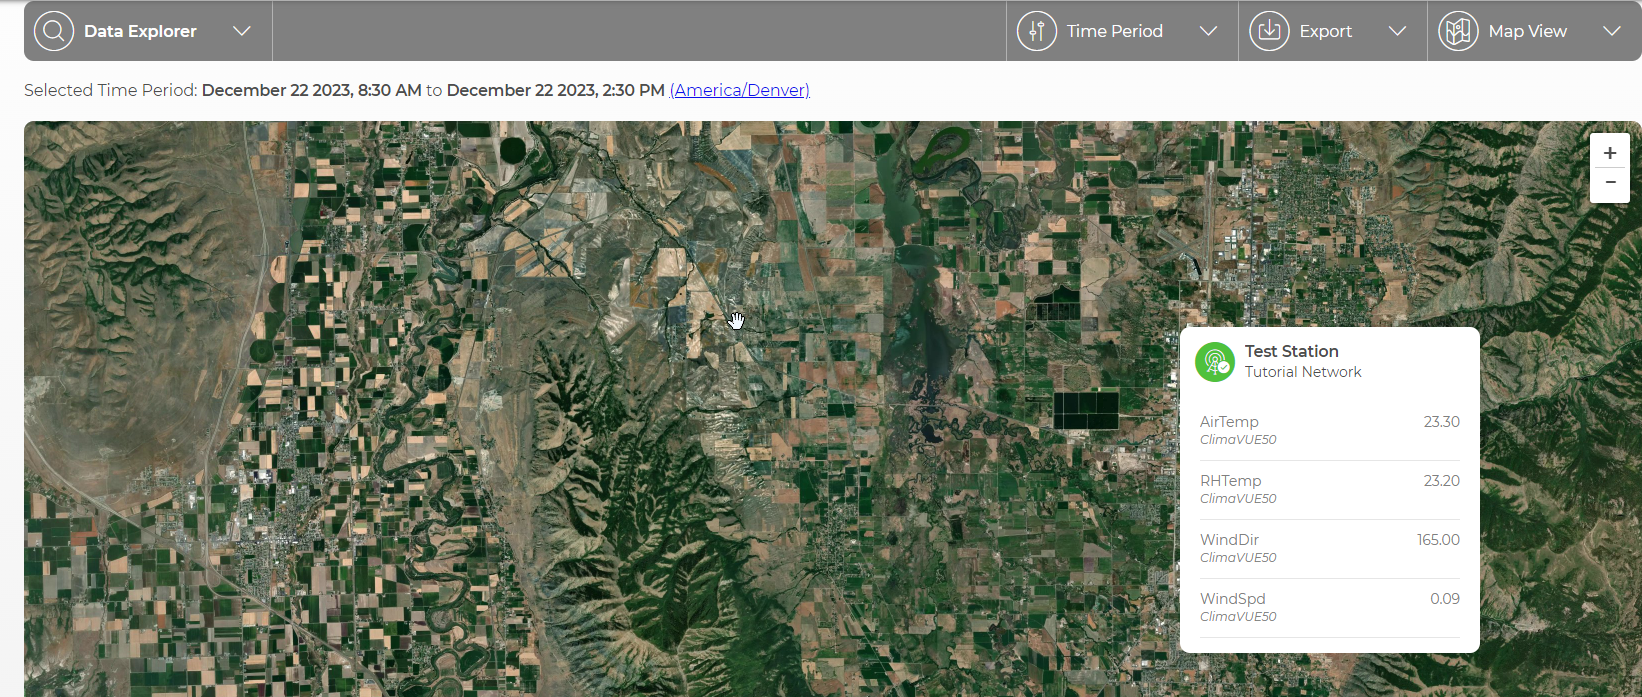
The Data Explorer application allows rapid exploration of your stored Cloud data through table, chart, and map views. It features a menu with a structured hierarchy of Network > Station > Measurements and includes a quick search filter. Users can apply time-based filters for efficient navigation and visualization of data over selected time frames. Additionally, there is an option to export the displayed data to comma-separated values (CSV) files. See Viewing historical data using Data Explorer for details.
Up to 15,000 data points per measurement can be displayed.
The precision displayed in CampbellCloud defaults to 2. For some measurements, it may be necessary to increase the precision. You can change the precision for a single measurement from the Measurement Properties in Assets. You can change the precision for all measurements (except those with the precision set in Measurement Properties) by Changing user settings.
See Viewing historical data using Data Explorer for more details.


