Viewing historical data using Data Explorer
Use the Data Explorer app in CampbellCloud to view historical data.
-
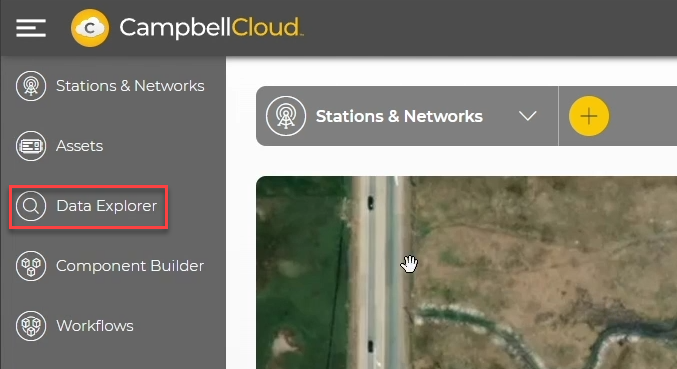
Click Data Explorer from the application menu.
-
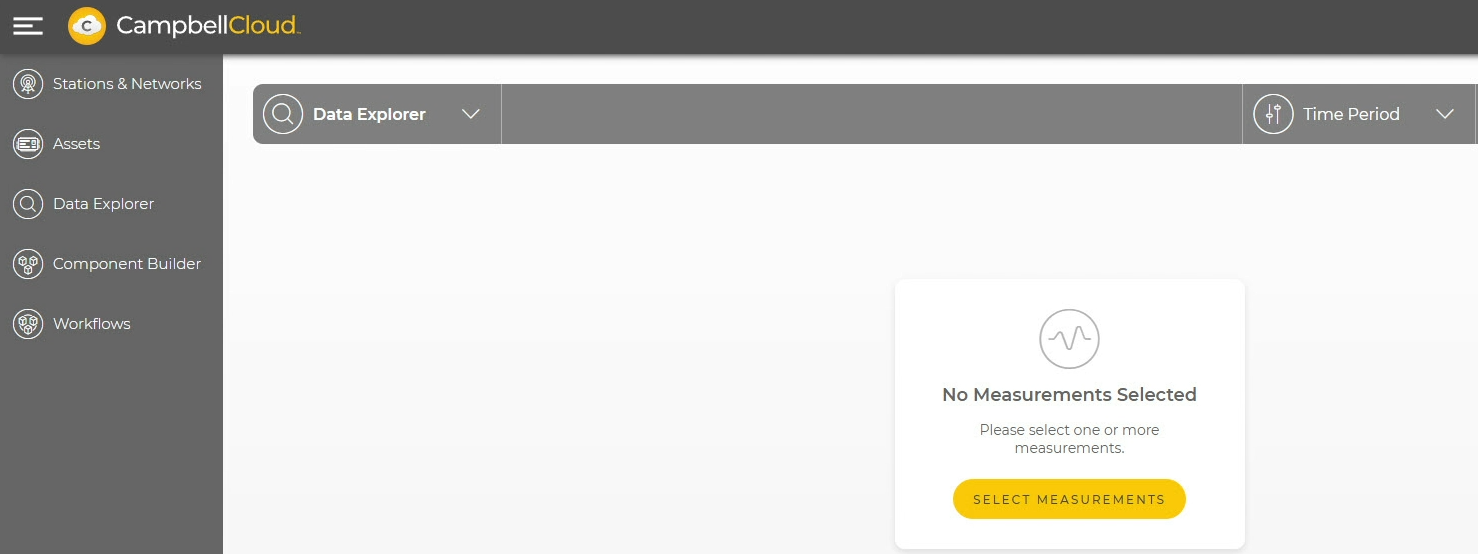
The display switches to Data Explorer. If a station has not previously been viewed, you will be prompted to SELECT MEASUREMENTS.
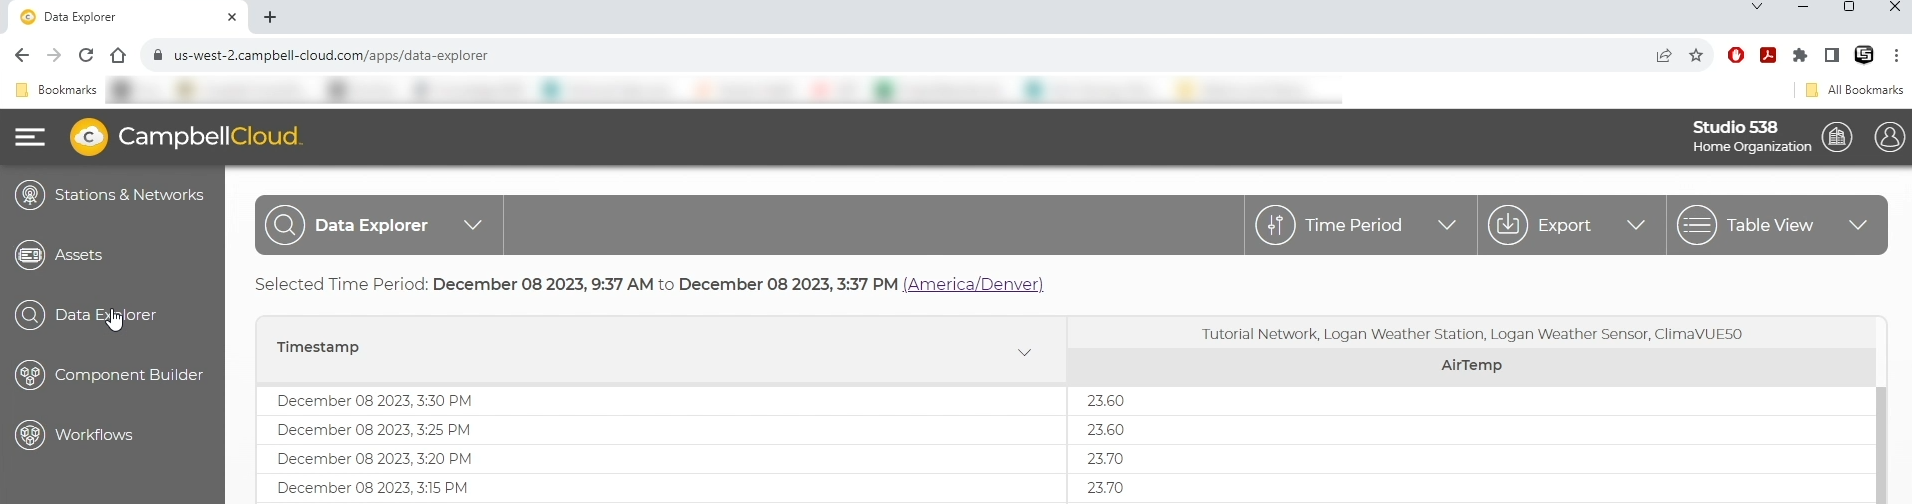
If you are viewing a station that has been previously viewed, the last measurements viewed from that station will be shown. In this example, the air temperature measurement from the ClimaVue™50 is displayed.
-
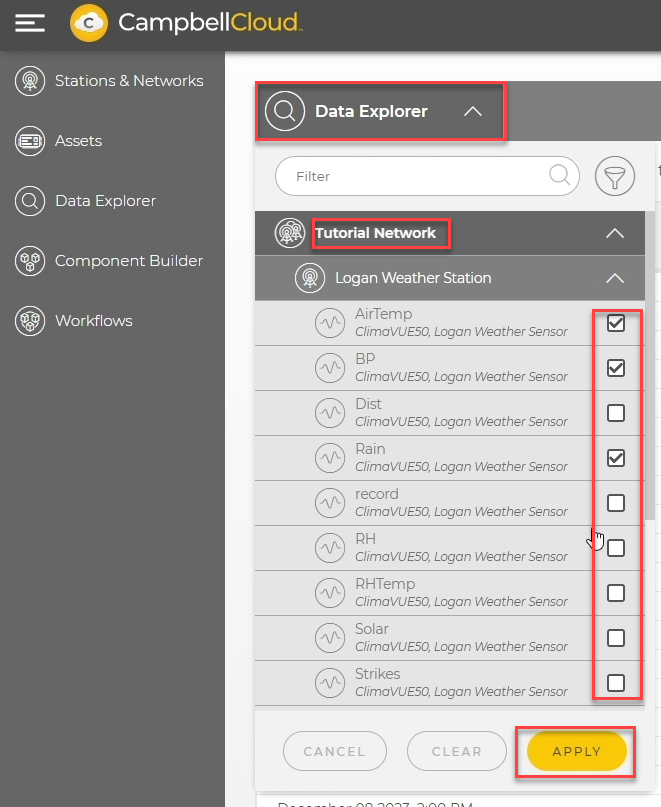
To view additional measurements, click the dropdown menu for Data Explorer, then select the network and then the station. All the available measurements for the station are shown. Click the check box next to each measurement you wish to view and click APPLY.
NOTE:To view Status table measurements or measurements from inactive or deleted assets, click the filter button and select the appropriate slider.
NOTE:Up to 15,000 data points per measurement can be displayed.
-
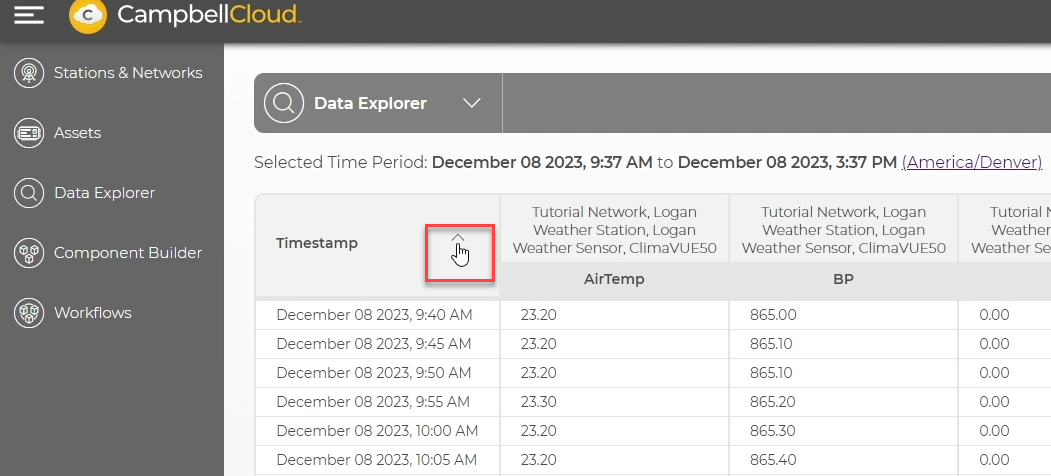
By default, the most recent measurement is shown at the top. To show the oldest data first, click on the arrow next to Timestamp.
-
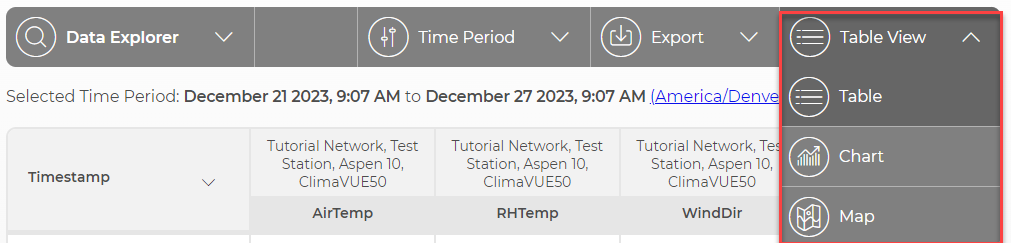
To switch from Table to Chart or Map view, click the down arrow next to your current view and select a different option.
-
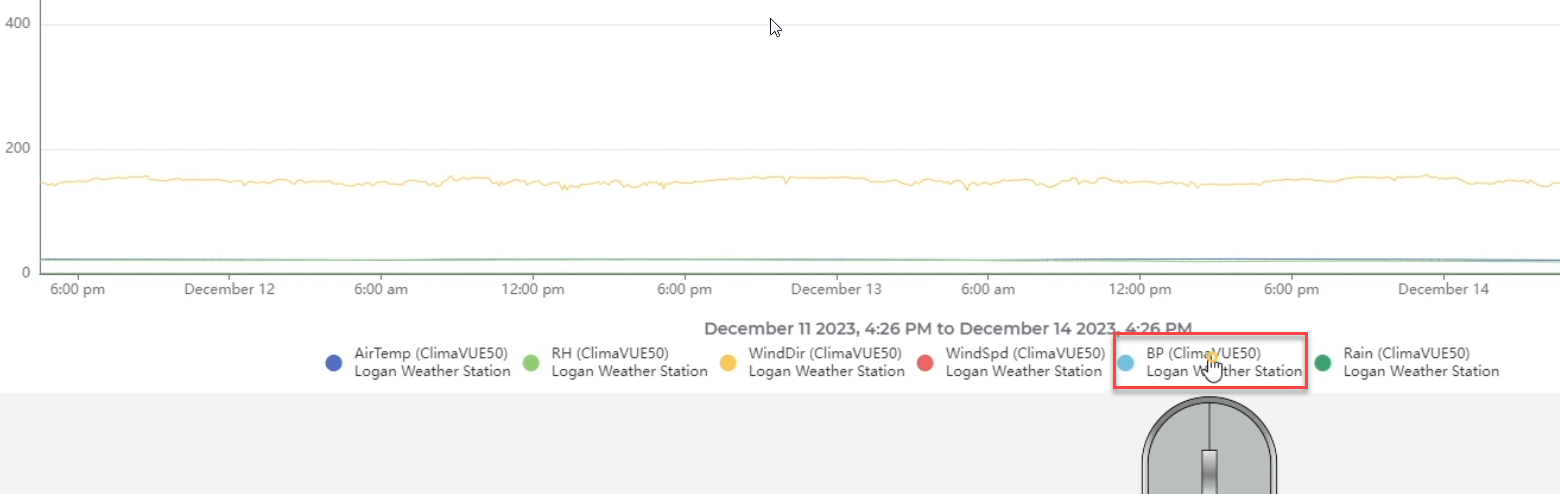
In Chart view, clicking a measurement along the bottom will toggle that measurement on and off.
NOTE:When units are assigned to measurements, they are displayed on the left and right axes. Only measurements with those specific units are charted at one time. For example, temperatures in °C and relative humidity in % can be displayed simultaneously. However, if rain in mm was selected, it would not be charted.
You may see the following error:
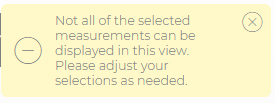
-
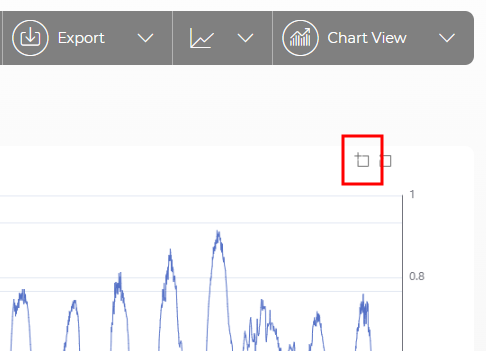
Zoom in on specific data in Chart view by toggling the Zoom feature then using your mouse to select the specific time period.
-
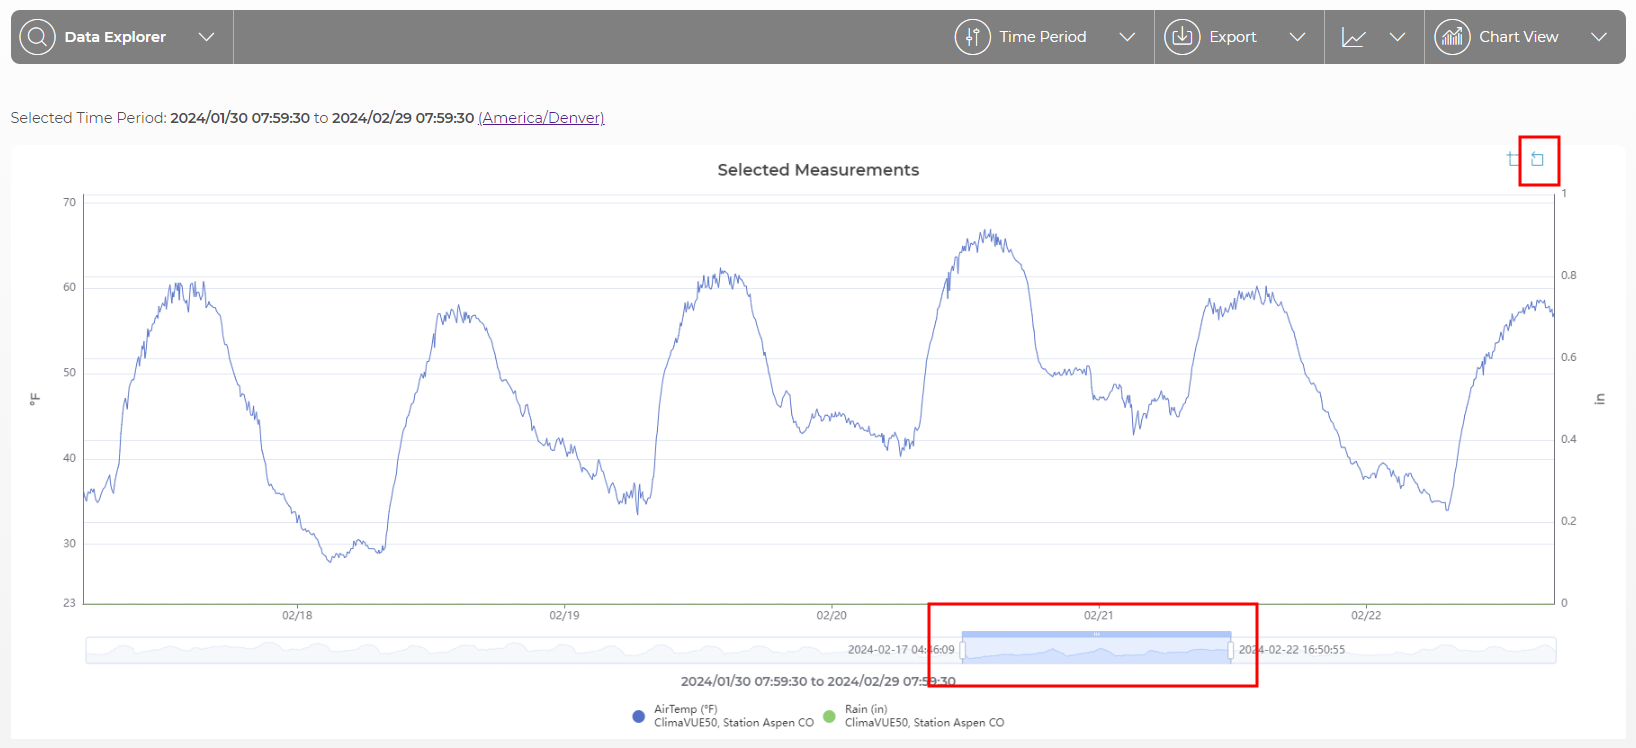
Once zoomed in, drag the scroll bar at the bottom to view other locations of the graph at the current zoom level. Use Zoom Reset to return to previous zoom levels.
-
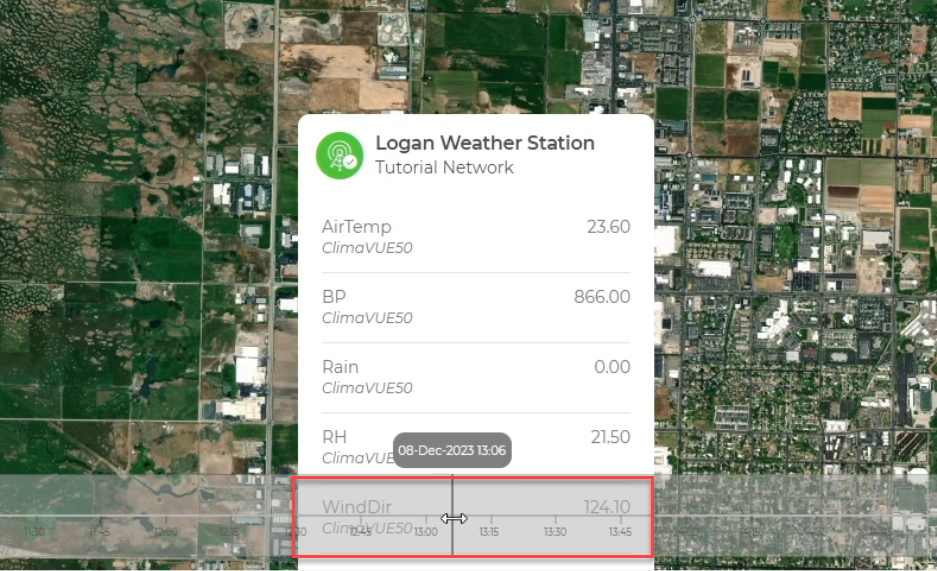
A slider bar along the bottom of the Map view allows scrolling through the data to show the measurements at different times.
-
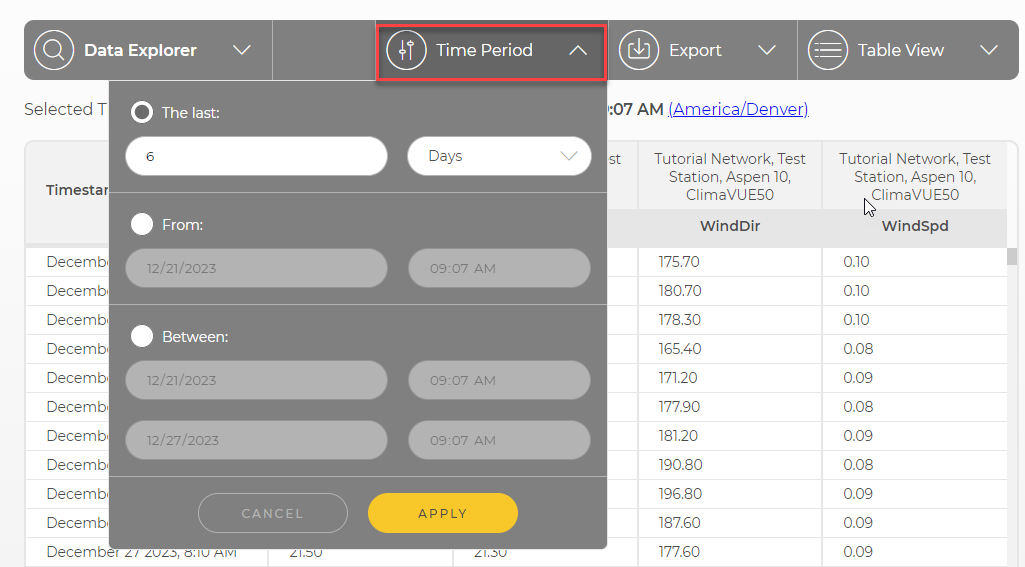
Menus along the top of the screen also allow selection of the Time Period being displayed.
-
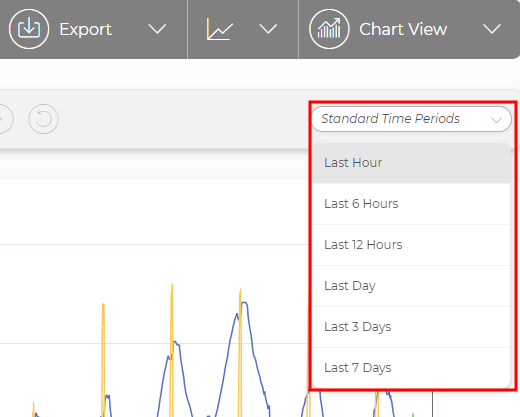
Use the down arrow near the top right to select a standard time period to display.
-
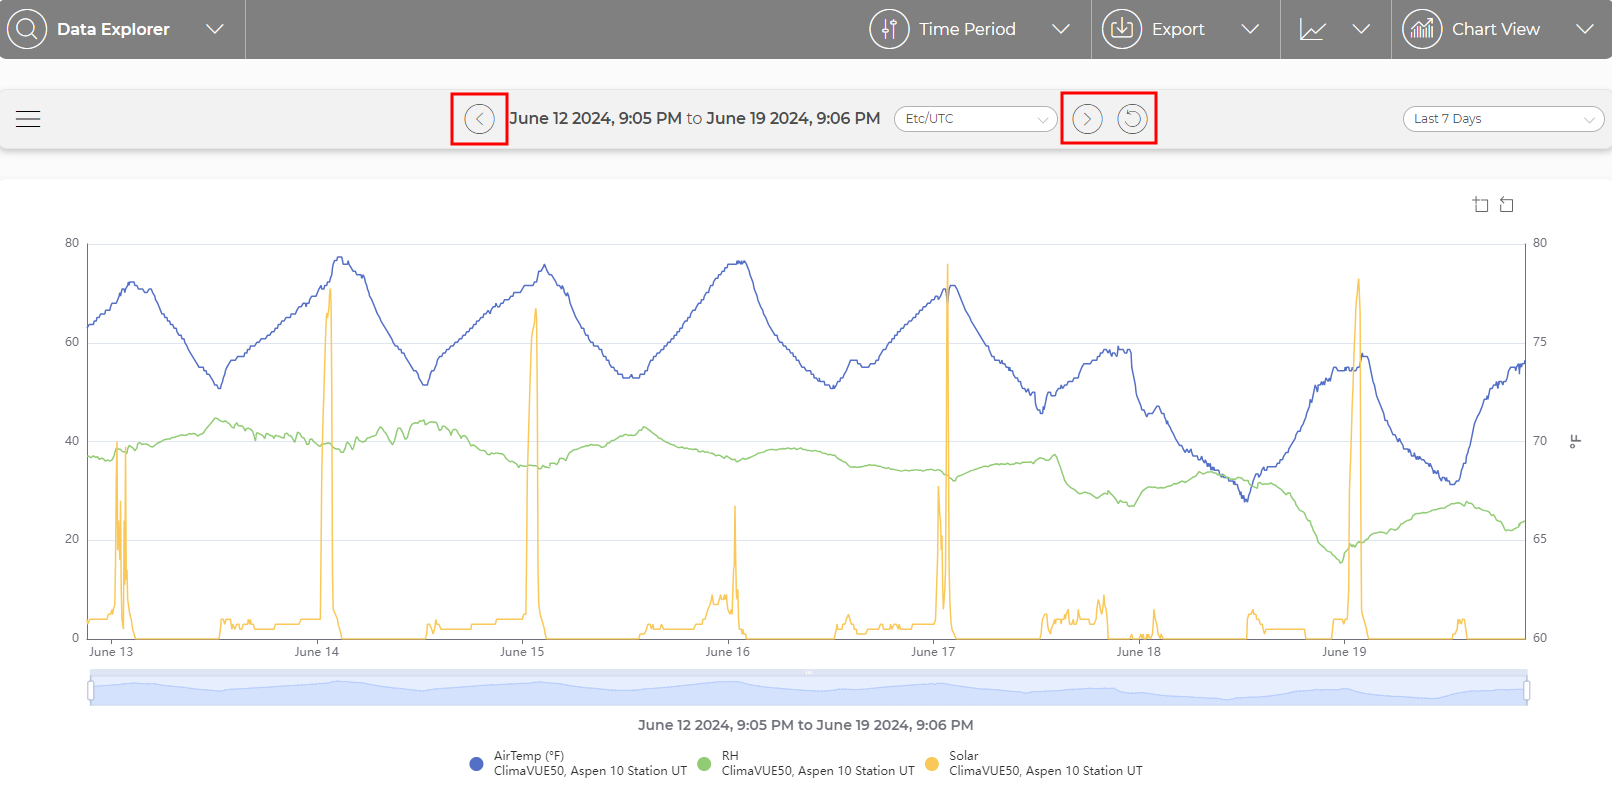
Use the left and right arrows at the top of a Chart to move backward or forward through time at the current display time period. Use reset to return to the original time period.
-
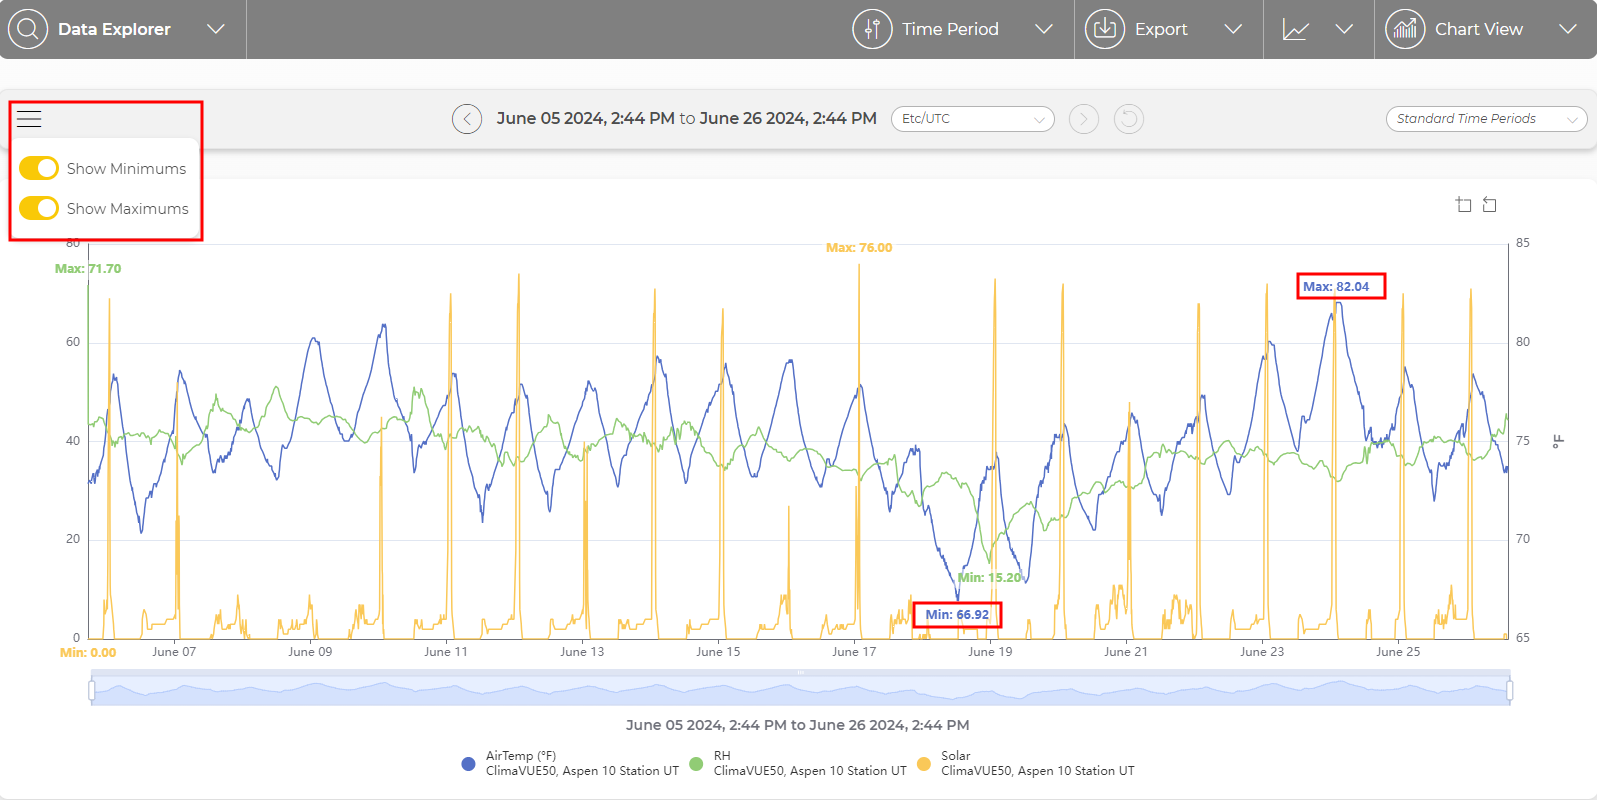
Use the hamburger menu near the top left to display maximum and/or minimum values.
-
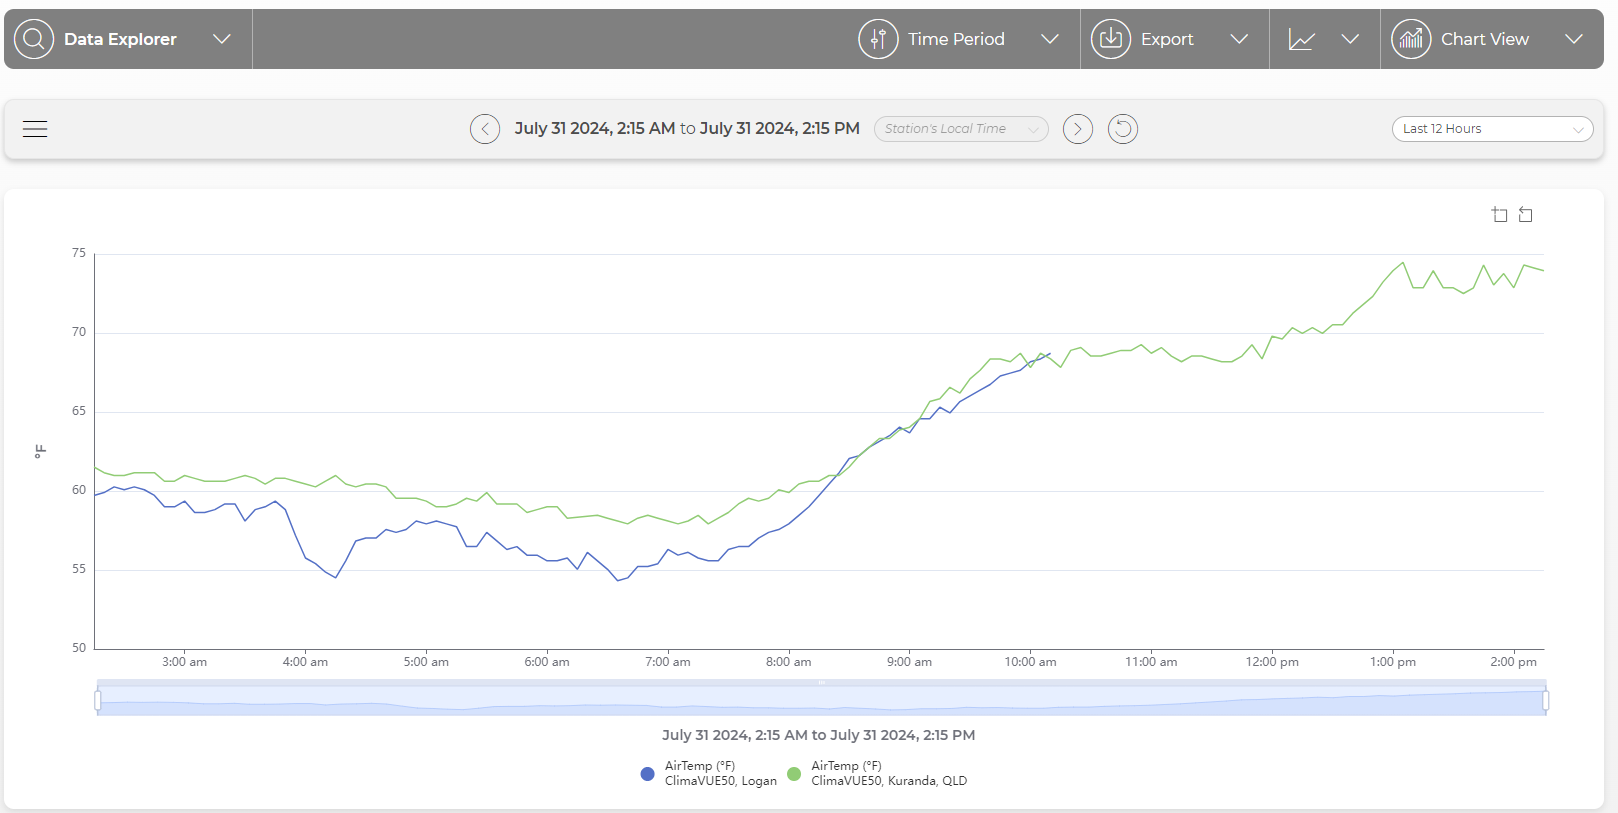
When viewing data from multiple timezones on a chart, you can use the hamburger menu to select Time Zone Alignment. When using the time zone alignment feature, all plotted measurements are placed onto a Local Station Time axis, meaning a 2:00 pm measurement on the chart was sampled at 2:00 pm local station time no matter where in the world the station is located. This allows you to more easily visualize the maximums and minimums since all measurements are displayed based on local station time.
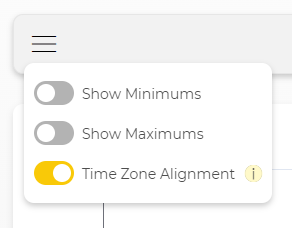
Chart before time zone alignment:
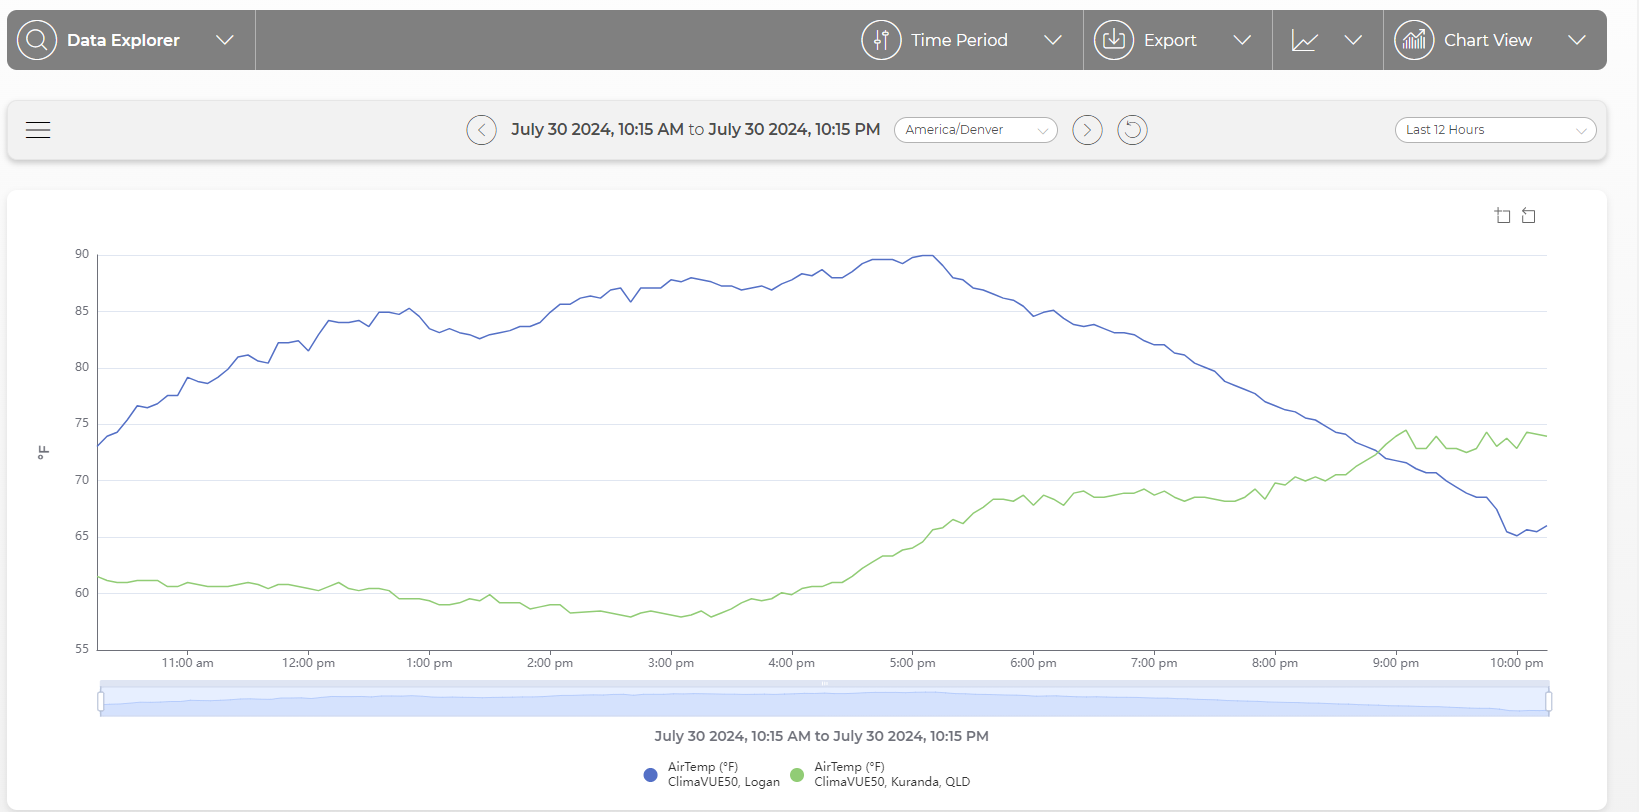
Chart with time zone alignment:
-
There is a Metadata Inspector feature available in the Data Explorer application. It provides detailed contextual metadata about selected datapoints.
-
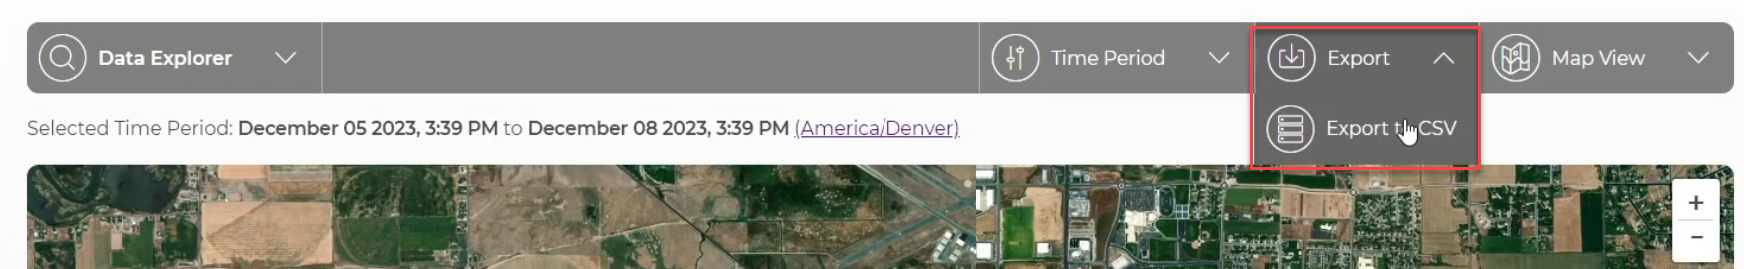
There is also an option to Export the data as a comma-separated values (CSV) file for further data processing.