RTMC Pro Real Time Monitoring and Control Software
RTMC is an application used to graphically display data from a LoggerNet datalogger network or RTDAQ datalogger. Available components include status bars, digital displays, charts, gauges, tables, and alarms. In addition, RTMC can be used to remotely control a datalogger and its peripherals by toggling ports and flags with switch components, and it can be used to set input locations or variables in a datalogger with value setter components.
Two versions of RTMC are available. A standard RTMC Development version ships with LoggerNet and RTDAQ. RTMC Pro has many enhancements over the standard version. RTMC Pro contains more graphical components than RTMC. For example, more alarms (multi-state), alarm events (email, FTP, run/open), switches (lever, rocker, rotary), charts (XY and scope), gauges (rotary, compass), and layout components (group box, bevel, panel) are available. For components that exist in both versions, more properties have been exposed in RTMC Pro resulting in more design control. RTMC Pro also includes run/open button, hotspot, snapshot, and alarm log capabilities. In LoggerNet, you also have the ability to add data files, LNDB databases, HTTP dataloggers, virtual data sources, and additional LoggerNet servers as data sources for RTMC Pro projects. RTMC Pro also comes with the CSI Web Server and Web Publisher which allow you to publish your project to the web through either a PC website or through a web-enabled datalogger like a CR6 or a CR1000 with an NL121 attached.
NOTE: A project that is created with the standard RTMC Development version can be converted to RTMC Pro format. However, once a project is converted to RTMC Pro format, it cannot be opened in standard RTMC.
NOTE: Starting with LoggerNet 4.8, RTMC will no longer be updated if a version of RTMC Pro earlier than 5.0 is installed on the computer. This is to maintain full compatibility with the installed RTMC Pro package.
Adding Components to the Workspace
Click an item on the Component Toolbox (see below), and then click within the Workspace to add the component to the display.  ). If you decide not to insert the component, press the component's button in the toolbox again to return the cursor to its normal state.
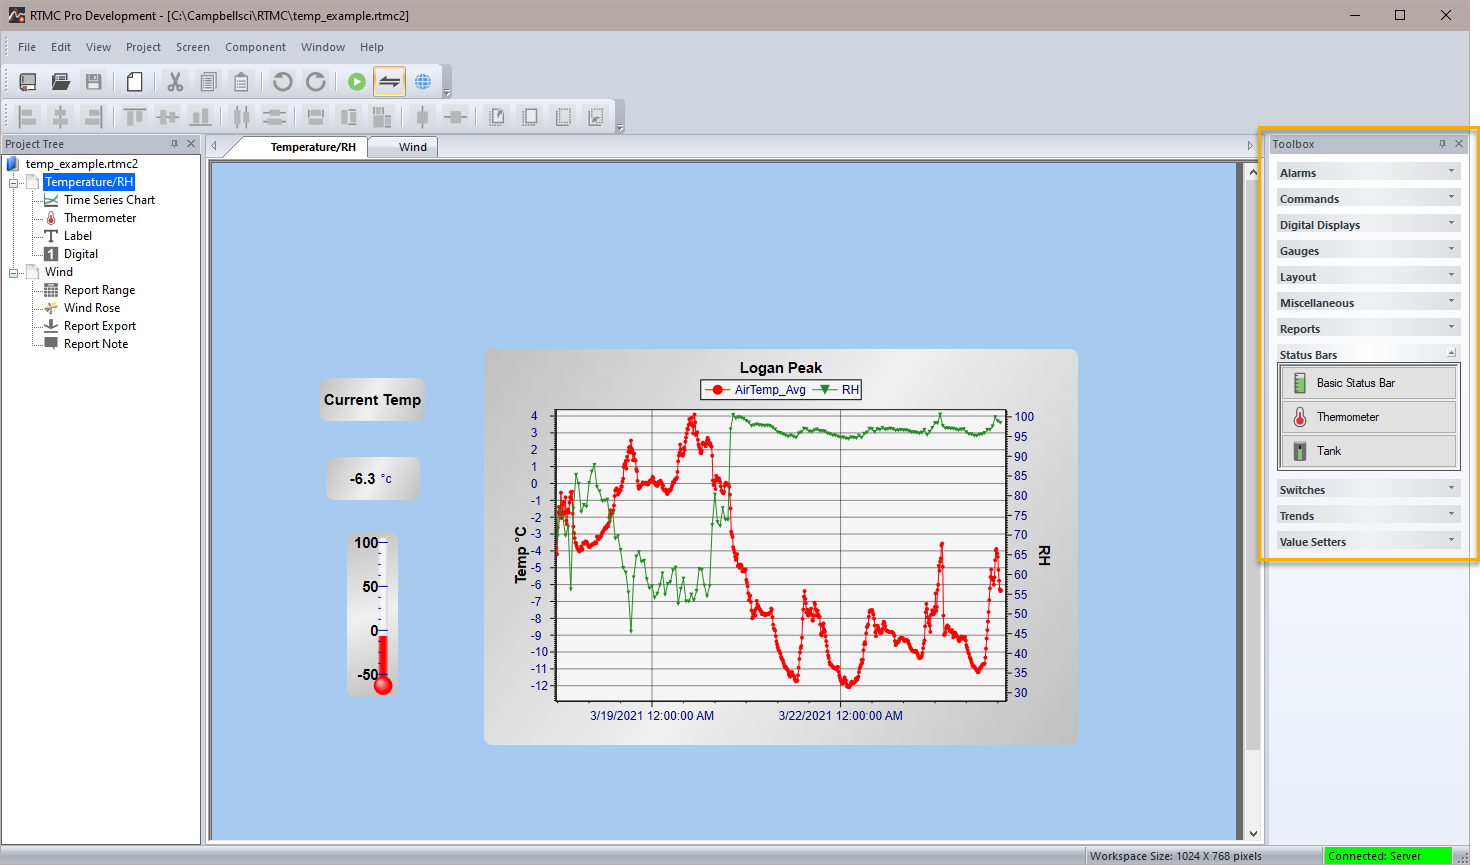
For more information, see Component Toolbox.
Adding Tabbed Screens
When a new project is started in RTMC, it has only one screen on which to place components. However, more screens can be added. Each screen will appear in the project tree and as a tabbed page in the workspace. A new screen can be added using the Project | Add New Screen menu or by selecting an icon from the Standard Toolbar. Navigate between the screens using the tabs at the top of the workspace.
The Add Screen icon is highlighted below.
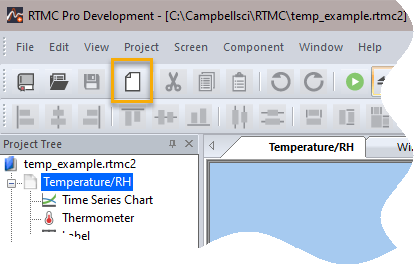
The order in which the screens appear can be changed by selecting Project | Change Screen Order from the menu. A dialog box with all the screen names listed is displayed. Highlight a screen name and use the up or down arrow buttons to change the order of the screens.
Execution Modes
Development Mode - The development mode is used when creating projects to be displayed by RTMC. The development mode is launched when RTMC
Run-time Mode - The run-time mode is used to display a completed project. The run-time mode is launched when RTMC Run-time is selected from the LoggerNet or RTDAQ toolbar. In LoggerNet, it can also be started by choosing All Apps | Campbell Scientific | RTMC Run-time from the Windows Start menu or by Saving and Running the project within the development mode (File | Save and Run Project or the  icon.)
NOTE: In RTDAQ, you must be connected to a datalogger for the RTMC Run-time icon on the RTDAQ toolbar to be enabled. Also, the option to Save and Run Project and the associated button are not available when running the development mode of RTMC from RTDAQ.
Data Displayed by RTMC
LoggerNet - RTMC displays data from LoggerNet's binary data cache, not from a data file.
For instance, in the example below, the Public, Status, and DataTableInfo tables are not being collected from the Logan datalogger.
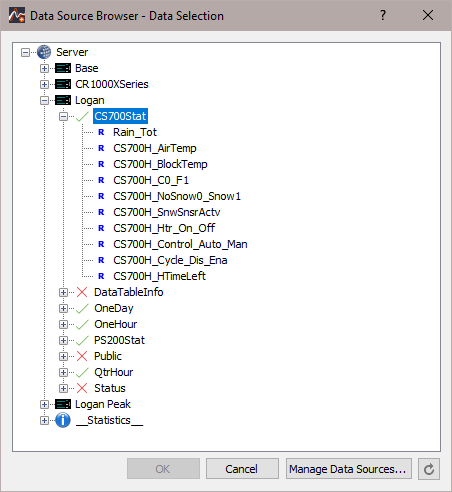
In this instance, if a data value from the Public, Status, or DataTableInfo table is associated with a component, that component will likely not be updated when RTMC is run. Scheduled collection can be enabled and tables can be included for data collection in LoggerNet's Setup window.
In RTMC Pro, you can also set up data collection from the Project | Configure Override Scheduled Collection menu item. This data collection will be in addition to any scheduled collection setup in LoggerNet's Setup window. Using this option will not generate green check marks next to the table in the Data Source Browser. (Green check marks indicate only that the table is set up for scheduled collection in LoggerNet.) However, components will still be updated when RTMC is run.
Data displays will be updated no more frequently than data is being collected from the datalogger.
Input locations, public variables, ports, and flags will show only the current value in the datalogger -- the datalogger does not keep historical records for these values. A "snapshot" of these values will be updated only when data is collected.
RTDAQ – In RTDAQ, RTMC projects are limited to a single station. This station must be specified when a new project is opened. Thus when components are added to a project, only the specified station's tables and fields will be shown in the Data Source Browser. When associating a data value from a table with a component, the station's table will be represented with a green check mark when RTDAQ is connected to the station and monitoring the table through a real-time window (field monitor, table monitor, graph, etc.). A table will be represented with a red X when RTDAQ is not monitoring the table.
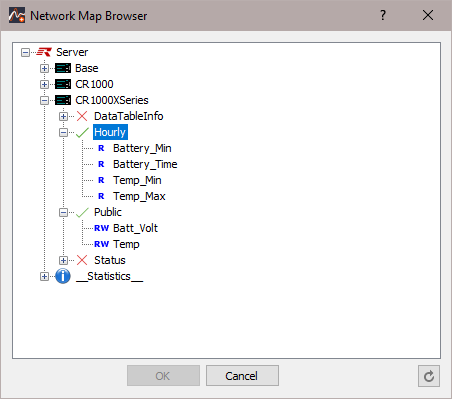
When RTDAQ is connected to the station, RTMC will perform a manual poll to update the project data every second. Thus, RTMC data displays will only be updated when RTDAQ is connected to the station.