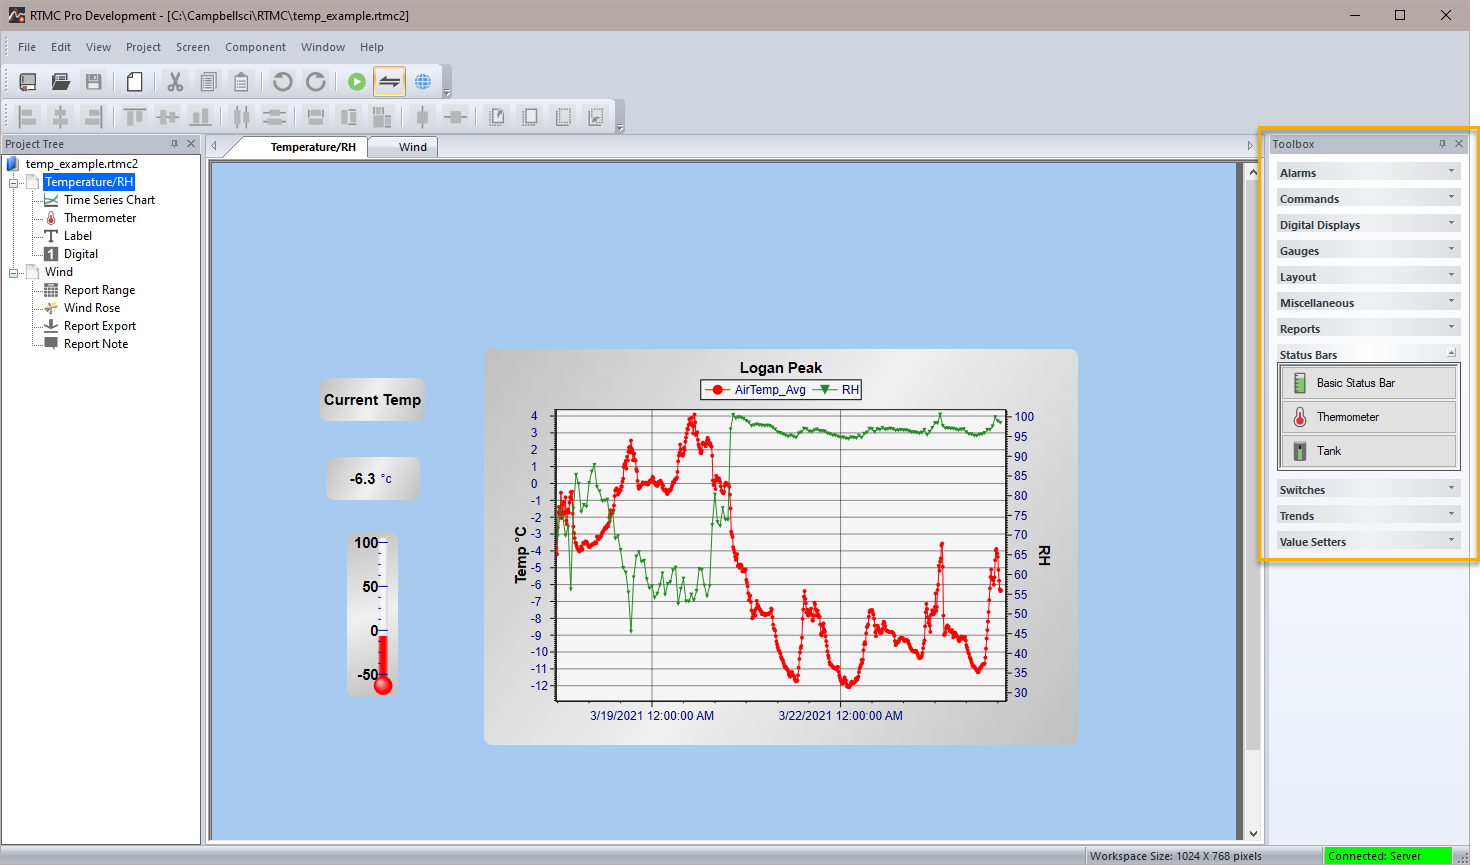
Component Toolbox
Components are the objects that are used to display data and create the graphical layout of the project. To add a component to the Workspace, click on an item in the Component Toolbox, then click anywhere in the Workspace. The component's Properties window is automatically displayed when the component is first placed in the Workspace. The Properties window is used to set colors, scale values, define text, etc., and to assign the data value to be displayed by the component.
After a component's properties have been set, select OK to apply the changes and close the Properties window. Once closed, the Properties window can be displayed by double-clicking the component. If you make changes to a component's properties but then decide to reject those changes, press the Cancel button to return the properties to the last applied state. If Cancel is selected when a component is first placed in the Workspace (and OK has not been pressed), the component will be removed from the screen.
NOTE: In LoggerNet, RTMC displays data from the data cache (and not from a collected data file). Data must be collected from the datalogger for the data cache to be updated, and therefore, for the RTMC displays to be updated. Typically this is done by setting up a schedule in LoggerNet's Setup window. Data displays will be updated no more frequently than data is being collected from the datalogger.
NOTE: In RTDAQ, when RTDAQ is connected to the datalogger, RTMC performs a manual poll every second to update project data. Therefore, RTDAQ must be connected to the datalogger for the RTMC displays to be updated.
NOTE:  An exclamation point in a red circle at the upper right of a component indicates a problem with the linked data value. Hover your mouse pointer over the box for a few seconds to display a hint about the error RTMC has detected.
NOTE:  A yellow N in a red circle at the upper right of a component indicates the value of the field referenced in the Select Data field of the component is currently a NaN.
The following components are available in RTMC Pro.
|
|
|
|
|
Provides visual and/or audible notification that a data value has exceeded a defined limit. An audible alarm can be silenced by right-clicking the component with your mouse and selecting Acknowledge Alarm. An alarm can also cause an email to be sent to a specified email address and/or a specified file to be run or opened. All events (audio, email, run/open) and alarm acknowledgement occur only when running the project in RTMC Run-time or CSI Web Server. |
|
|
Provides visual and/or audible notification that the rate of change of a data value has exceeded a defined limit. An audible alarm can be silenced by right-clicking the component with your mouse and selecting Acknowledge Alarm. An alarm can also cause an email to be sent to a specified email address and/or a specified file to be run or opened. All events (audio, email, run/open) and alarm acknowledgement occur only when running the project in RTMC Run-time or CSI Web Server. |
|
|
Provides visual and/or audible notification that no data has been received from a selected table for a specified period of time. An audible alarm can be silenced by right-clicking the component with your mouse and selecting Acknowledge Alarm. An alarm can also cause an email to be sent to a specified email address and/or a specified file to be run or opened. All events (audio, email, run/open) and alarm acknowledgement occur only when running the project in RTMC Run-time or CSI Web Server. |
|
|
Provides visual and/or audible notification when scheduled collection is disabled in the Setup Screen, the schedule is paused from the Status Monitor, or communication has failed a sufficient number of times to put the datalogger into a Primary or Secondary Retry mode (the retry mode used is based on the Condition property for the component). An audible alarm can be silenced by right-clicking the component with your mouse and selecting Acknowledge Alarm. An alarm can also cause an email to be sent to a specified email address and/or a specified file to be run or opened. All events (audio, email, run/open) and alarm acknowledgement occur only when running the project in RTMC Run-time or CSI Web Server. Note that if RTMC is launched from RTDAQ, a Comm Status Alarm will only be triggered when an RTDAQ real-time display is started or stopped. This is because RTDAQ uses scheduled collection to temporary collect areas in order to update the real-time displays. |
|
|
Provides visual and/or audible notification that a data value has exceeded a defined limit. An audible alarm can be silenced by right-clicking the component with your mouse and selecting Acknowledge Alarm. An alarm can also cause an email to be sent to a specified email address and/or a specified file to be run or opened. All events (audio, email, run/open) and alarm acknowledgement occur only when running the project in RTMC Run-time or CSI Web Server. |
|
|
Provides visual and/or audible notification of the state of a data value. Default states include Off, Warning and Critical. These can be changed and additional states can be added. An image, sound file, email, and/or run/open can be defined for each state. An audible alarm can be silenced by right-clicking the component with your mouse and selecting Acknowledge Alarm. All events (audio, email, run/open) and alarm acknowledgement occur only when running the project in RTMC Run-time or CSI Web Server. |
|
|
Provides a button that will run/open a specified file (*.exe, *.bat, *.doc, etc.) when pressed. |
|
|
Provides a button that will execute a specified CoraScript command when pressed. CoraScript is a set of commands that can be used to interact with the communications server. |
|
|
Provides a hotspot that will jump to a specified RTMC screen or open a web browser to a specified web address when pressed. In RTMC-RT the hotspot will be invisible. The only indication of a hotspot will be the changing of the cursor when hovering over the hotspot. A label, button, or other component can be used to indicate what the hotspot will do when clicked. |
|
|
Depicts the selected data value as a numeric value, text string or Boolean. |
|
|
Depending upon the option chosen, displays the server time, server time at last data collection, station time, station time of last record stored, PC time, or a time stored in the data tables (such as time of maximum or minimum). |
|
|
Displays the selected data value on a gauge. In run-time mode, max and min pointers can be reset by right-clicking the component. |
|
|
Displays the selected data value on a rotary gauge. |
|
|
Provides an eight-point compass on which to display data. |
|
|
Displays wind speed and wind direction from a datalogger table in the form of a windsock. |
|
|
Displays a static text string that can be used to label other components or simply add text to the project. |
|
|
Places an image on the display. |
|
|
Places an image on the display that changes according to a data value.. |
|
|
Places a box on the display in order to group components together. |
|
|
Places a panel on the display that can be used to group components together. |
|
|
Places a circle, ellipse, square, rectangle, rounded rectangle, rounded square, circle pie, isosceles triangle, right triangle, trapezoid, diamond, parallelogram, pentagon, hexagon, octagon, cross, ring, arc, cylinder, cube, folded corner or frame on the display. |
|
|
Displays a static text string that can be used to label other components or simply add text to the project. |
|
|
Places a straight line on the display. |
|
|
Places a curved line on the display. |
|
|
Places an arc line (section of a circle) on the display. |
|
|
Provides a motor that can be depicted as on or off based on a data value. |
|
|
Displays a pipe. The flow through the pipe can be determined by a data value. A pipe is horizontal by default. To make a vertical pipe, unlock the aspect ratio and resize it so that it is taller than it is wide. |
|
|
Provides a pipe joint that can be used to connect two pipes. |
|
|
Provides a valve that can be depicted as open or closed based on a data value. |
|
|
Provides a button bar that allows the user to customize the date range of their report. It also provides buttons in RTMC Run-time to step through data or jump to a specific date. (See Reports in RTMC.) |
|
|
Displays the report range. The user can customize the dates shown and the format used. In run-time mode, the header updates as the report date range changes. (See Reports in RTMC.) |
|
|
Allows the user to insert custom notes at run-time before the report is exported. Notes are temporary and are lost when the report is closed. (See Reports in RTMC.) |
|
|
Provides options for controlling how reports get exported. Export options include HTML, PDF, PDF(Image), PNG, JPEG, GIF, and BMP. The reports can also be set up so they are printed, emailed or FTP'd when the report is exported. The component also allows you to specify which of the above export options are available in RTMC Run-time. (See Reports in RTMC.) |
|
|
Depicts the selected data value as a single vertical or horizontal bar. In run-time mode, max and min pointers can be reset by right-clicking the component. |
|
|
Displays the data value on the image of a thermometer. In run-time mode, max and min pointers can be reset by right-clicking the component. |
|
|
Displays the data value as the level in a tank. |
|
|
Indicates the state of a port, flag, input location, or public variable. A 0 is considered Off (false); any non-zero number is considered On (True). In run-time mode, right-click a switch to change its state. The option to change the state of a switch with a double-click or a single-click can be enabled in the Properties window. |
|
|
Indicates the state of a port, flag, input location, or public variable by the color of an LED. A 0 is considered Off (false); any non-zero number is considered On (True). In run-time mode, right-click a switch to change its state. The option to change the state of a switch with a double-click or a single-click can be enabled in the Properties window. |
|
|
Indicates the state of a port, flag, input location, or public variable by the position of a lever. A 0 is considered Off (false); any non-zero number is considered On (True). In run-time mode, right-click a switch to change its state. The option to change the state of a switch with a double-click or a single-click can be enabled in the Properties window. |
|
|
Indicates the state of a port, flag, input location, or public variable by the position of a rocker. A 0 is considered Off (false); any non-zero number is considered On (True). In run-time mode, right-click a switch to change its state. The option to change the state of a switch with a double-click or a single-click can be enabled in the Properties window. |
|
|
Indicates the state of a port, flag, input location, or public variable by the position of a rotary dial. The default switch has two positions. A 0 is considered Off (false); any non-zero number is considered On (True). Other positions can be added. In run-time mode, click on a position to change to that state. |
|
|
Indicates the state of a port, flag, input location, or public variable by the position of a horizontal or vertical bar. The default switch has two positions. A 0 is considered Off (false); any non-zero number is considered On (True). Other positions can be added. In run-time mode, click on a position to change to that state. |
|
|
Indicates the state of a port, flag, input location, or public variable by displaying an option from a list designated by the user. The default drop list has two options. A 0 is considered Off (false); -1 is considered On (True). Other options can be added. In run-time mode, click on the component to display the list of options and change the value of the variable. |
|
|
Displays one or more time domain series on a chart. The time stamp on the X axis reflects the data timestamp. In run-time mode, a portion of the chart can be "zoomed in on" by dragging a frame around the area to be viewed. Right-clicking the chart will bring up a menu that allows the chart to be printed, copied, saved or zoomed to all data. If the Allow Run-time Customization check box is selected in RTMC Pro, this menu will also include a Customize item that allows the Run-time user to change any of the chart’s properties. |
|
|
Displays one or more XY series on a chart. The user specifies what will be used for both the X axis data values and the Y axis data values. Each X axis data value is plotted against the Y axis data value with an identical timestamp. In run-time mode, a portion of the chart can be "zoomed in on" by dragging a frame around the area to be viewed. Right-clicking the chart will bring up a menu that allows the chart to be printed, copied, saved, or zoomed to all data. If the Allow Run-time Customization check box is selected in RTMC Pro, this menu will also include a Customize item that allows the Run-time user to change any of the chart’s properties. |
|
|
Displays one or more series on a chart. The time stamp on the X axis reflects the data timestamp. The Scope is similar to the Time Series Chart, but has the appearance of an oscilloscope screen and has the ability to display data at a faster rate. In run-time mode, right-clicking the scope will bring up a menu that allows the scope to be printed, copied, saved, or zoomed to all data. If the Allow Run-time Customization check box is selected in RTMC Pro, this menu will also include a Customize item that allows the Run-time user to change any of the scope’s properties. |
|
|
Displays the data from a datalogger table in a row and column format. In run-time mode, right-clicking the table will bring up a menu that allows the table to be printed, copied, or exported. It also allows you to remove all data from the table or select the columns being displayed. |
|
|
Displays wind speed and wind direction from a datalogger table in the form of a wind rose. |
|
|
Displays a spatial interpolation chart .Similar data points (that is, same type of measurement and same units) from multiple stations are added according to the relative positions of the stations. The component provides a spatial interpolation of the value of the measurement between the stations. |
|
|
Depicts the selected data value as a single horizontal or vertical bar. In run-time mode, the data value can also be set to a new value by dragging the slider. |
|
|
Like the Digital component, depicts the selected data value as a numeric value, text string or Boolean. However, in run-time mode, a data value can also be set to a new value by double-clicking the component and entering a new value in the resulting dialog box. |
|
|
In run-time mode, reads a value in a datalogger and writes to another value in that datalogger or a different datalogger. The value that is written can be the value read, a 0 or -1, or a specified constant. Note that in RTDAQ, RTMC projects are limited to a single station. Therefore, the value read can only be forwarded to another value in the same datalogger. |
|
|
Depicts the selected data value as a pointer on a dial. In run-time mode, the data value can also be set to a new value by dragging the pointer. |


NOTE: A description of each field in a component's Properties box can be displayed by pressing F1 or clicking the ? in the top right-hand corner of the dialog box while your mouse cursor is within the box.
Expressions
Components that display data values either numerically or graphically can be processed using mathematical expressions. For instance, a temperature reading in degrees Celsius can be processed to display in degrees Fahrenheit using a mathematical expression. For a list of functions and operators that are supported, see
NOTE: When referencing data from separate tables within the same expression, the
