Summary view
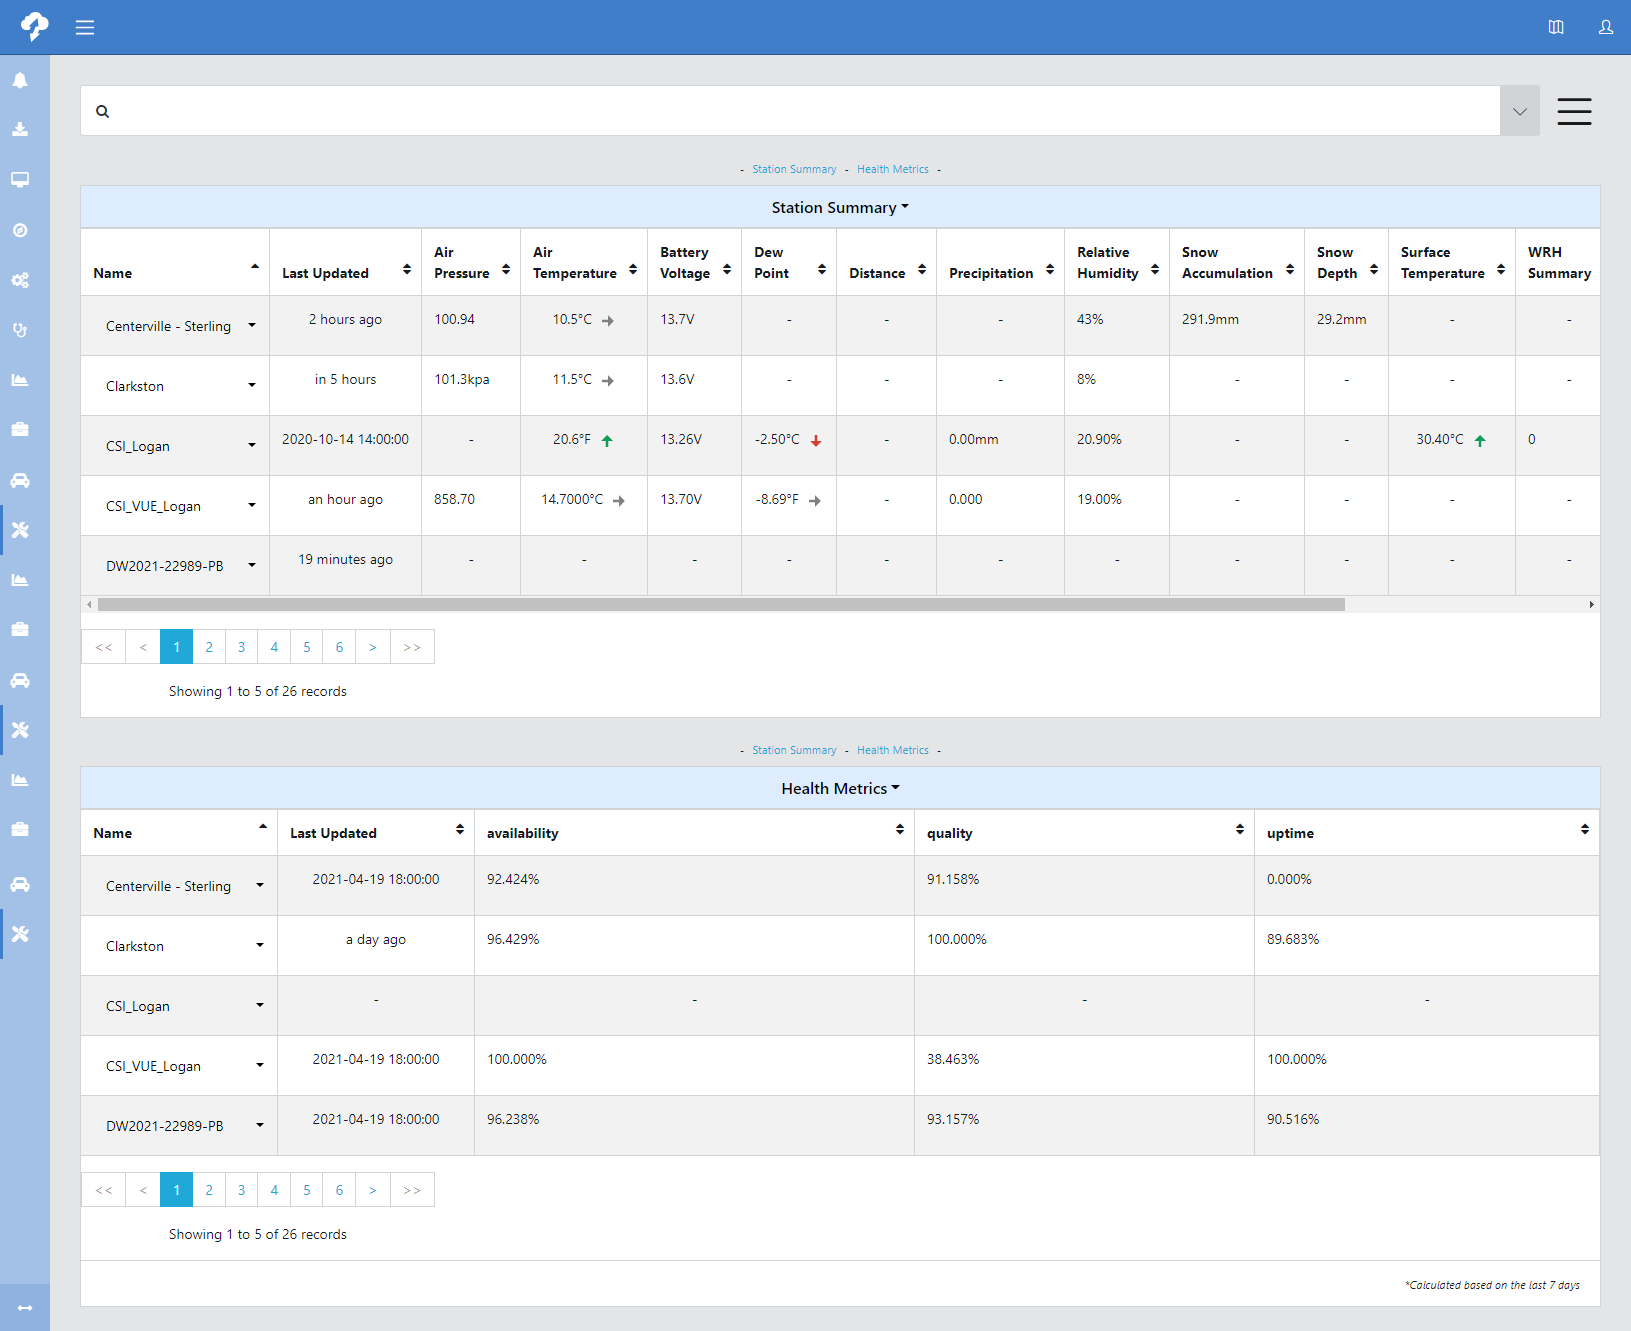
Summary view displays a Station Summary and Health Metrics for each station in the network.
In either list, use the drop-down next to a station name to:
-
view health metrics (see Network Health)
-
edit station metadata (see Station Management)
-
view portal dashboard (For CAMPBELL CLOUD users that have access to the older classic view screens, this option will take them there. It is not available for other users.)
Station Summary
The Station Summaryprovides a summary of when data was last updated from each station.
Click on a column heading to sort on that column. Click again to toggle ascending/descending order.
Use the drop-down menu next to Station Summary to set how many stations to view per page, to export the summary as a CSV, or to toggle trending arrows on/off.
Health Metrics
Health Metrics provides a summary of the statistics kept for each station. Information includes:
-
Name
-
Last Updated: When the statistics were last calculated.
-
availability: Percentage of expected data that has been received from the station.
-
quality: Percentage of data that is meeting the QA rules that have been set up for the station.
-
uptime: Percentage of data arriving within an hour of when it is expected to arrive.
The numbers displayed here are for a 7-day period. See Network Health for more information on these metrics.
Use the drop-down menu next to Health Metrics to set how many stations to view per page or to export the metrics as a CSV.