Alerts
Users with appropriate permissions will have access to the Alerts application. Alerts are notifications that are triggered when specified measurement conditions occur on a station. The Alerts application is used to create, view, edit, and delete alerts, as well as manage alerts when they are triggered.
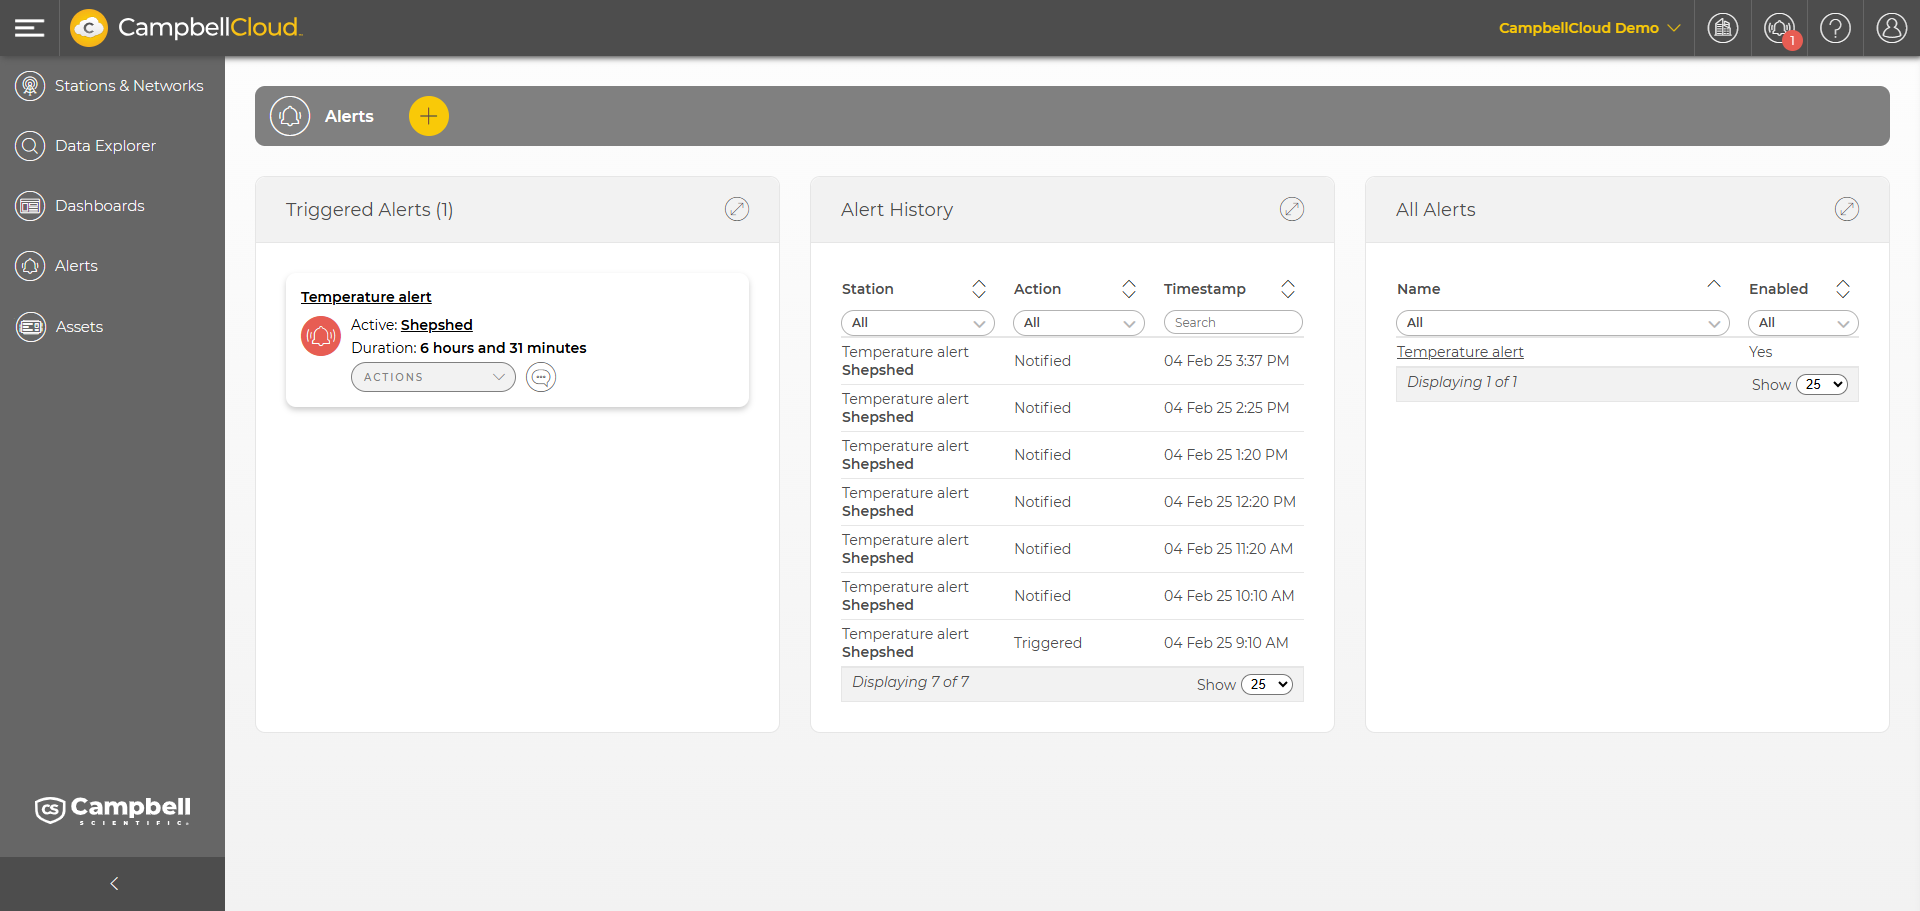
The Alerts application home page consists of a three panels:
-
Triggered Alerts panel: All current triggered alerts for the organization
-
Alert History panel: The most recent alert-related events
-
All Alerts panel: A list of all alerts the organization has created
Any of the three panels can be expanded to fill the application are by clicking  in the top right corner of the panel.
Triggered Alerts panel
The Triggered Alerts panel displays all triggered alerts for the organization that have not been cleared. The header of the panel indicates the number of alerts in parentheses. Click  to toggle the sort direction (newest first or oldest first based on trigger time).
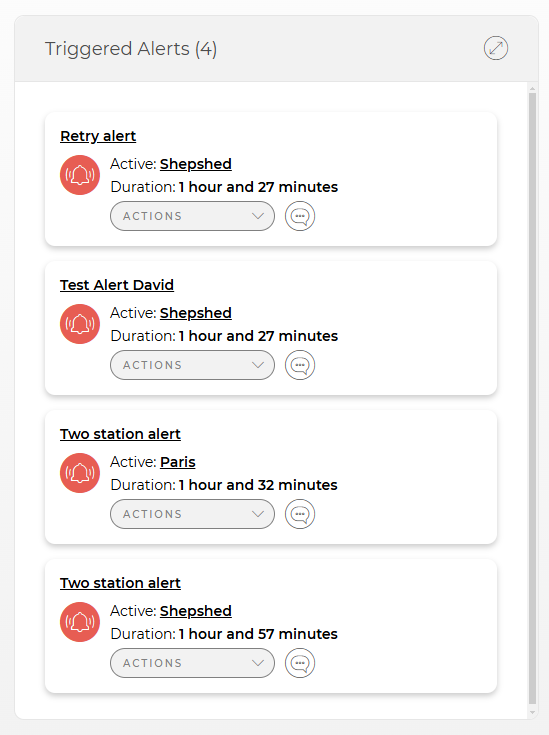
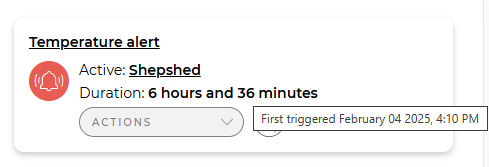
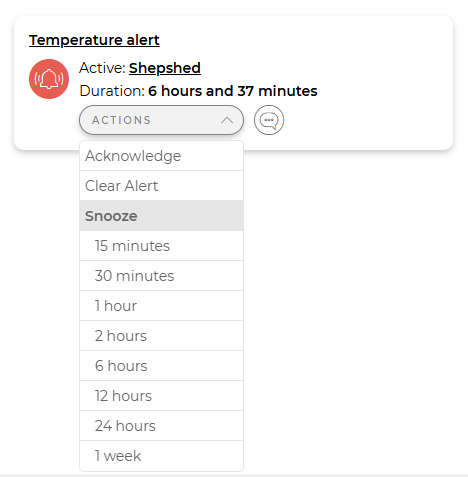
Each alert is displayed in its own card. The icon on the car indicates the alert state: red for active or yellow for snoozed. A green check mark indicates the alert has been acknowledged. Hover over the second line of the card (duration or alert or snooze time remaining ) to see additional information.
Use Actions to:
- Acknowledge - Mark the alert as “acknowledged” (doesn’t show if already acknowledged)
- Clear - Clear the alert
- Snooze - Snooze the alert
- 15 minutes
- 30 minutes
- 1 hour
- 2 hours
- 6 hours
- 12 hours
- 24 hours
- 1 week
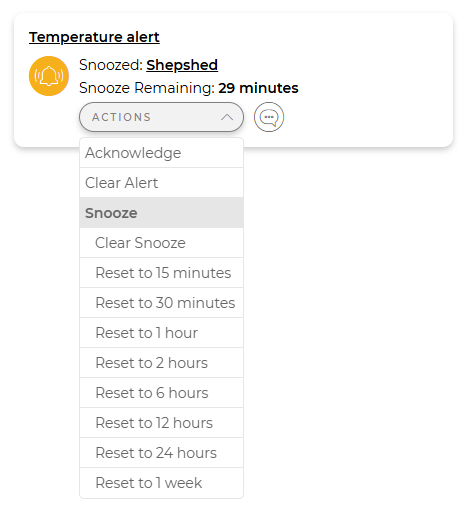
If the alert is already snoozed, the Snooze options allow you to reset the snooze time:
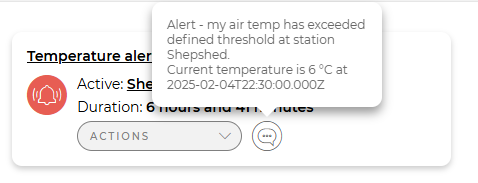
Hovering over the comment icon will display the alert message:
CampbellCloud will not automatically clear an alert. Alerts must be manually cleared by a user. This is intentional to ensure that alerts can't go unnoticed.
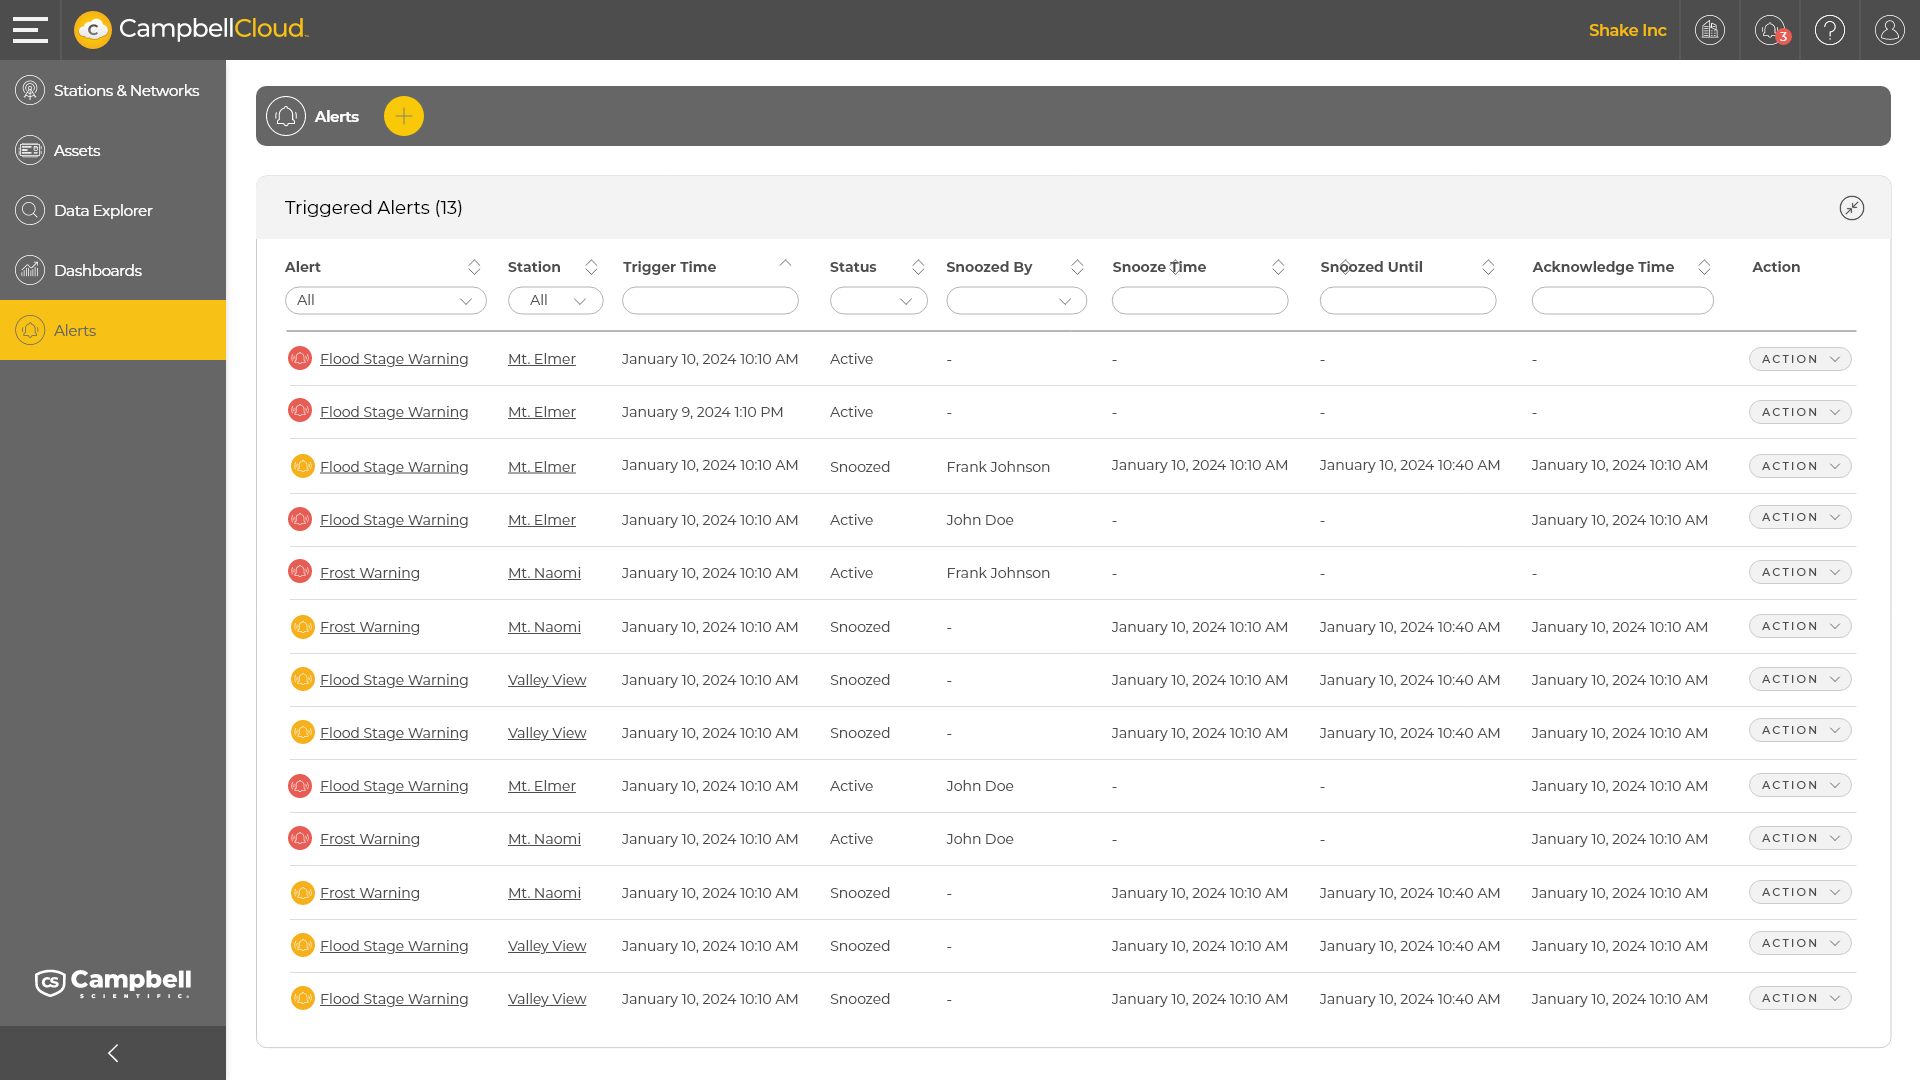
When the Triggered Alerts panel is expanded, it shows a table with the following columns:
- Alert - The name of the alert including the icon which indicates the alert state on the left. Click an alert name to go to the corresponding Alert Detail page.
- Station - The name of the station the alert pertains to. Click a station name to go to the corresponding station detail page.
- Trigger Time - The timestamp when the alert was triggered.
- Status - Active or Snoozed.
- Snoozed Until - The time at which the snooze will end.
- Acknowledge Time - The timestamp when the alert was acknowledged or a dash if it has not yet been acknowledged.
- Action - Allows the user to acknowledge, clear, or snooze (or extend or clear a snooze) an alert.
Use the sort icon next to a column heading to sort on that column.
Alert History panel
The Alert History panel displays all alerts events for the organization in reverse chronological order by default. Use the sort icon next to a column heading to sort on that column. Use the filter box under a column heading to filter on that column.
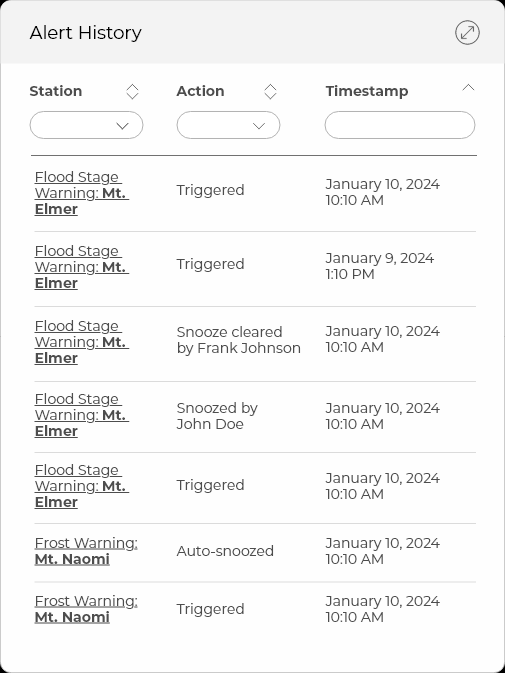
Each alert shows:
- Station - The name of the alert followed by the station the alert was triggered on (if there is one).
- Action - The action that took place (e.g., triggered, snoozed, snooze cleared, notified).
- Timestamp - The date and time at which the event occurred displayed in the user date/time preferred format.
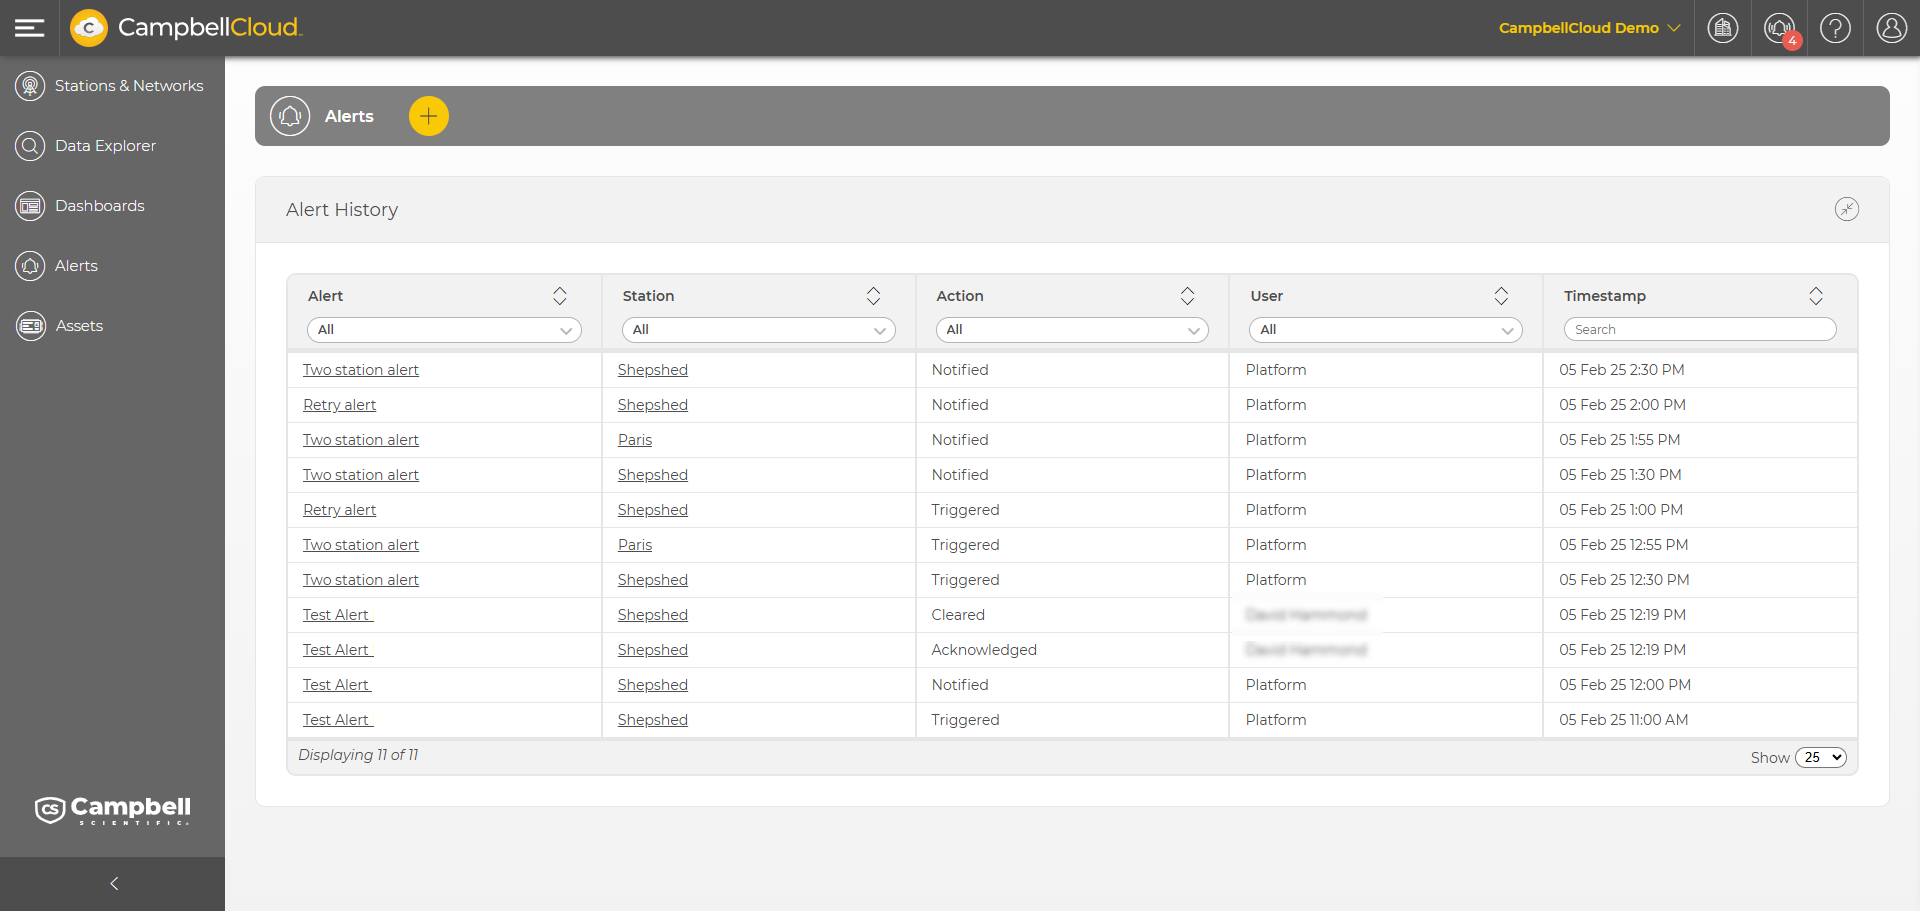
When the Alerts History panel is expanded, it shows a table with the following columns:
- Alert - Name of alert. Click an alert name to go to the corresponding Alert Detail page.
- Station - The name of the station the alert triggered on. Click a station name to go to the corresponding station detail page.
- Action - The action that took place.
- User - The user that triggered the event. If the event was triggered by Cloud, Platform is displayed.
- Timestamp - The date and time at which the event occurred displayed in the user date/time preferred format.
All Alerts panel
The All Alerts panel displays all the alerts that have been entered by the organization. Use the sort icon next to a column heading to sort on that column. Use the filter box under a column heading to filter on that column.
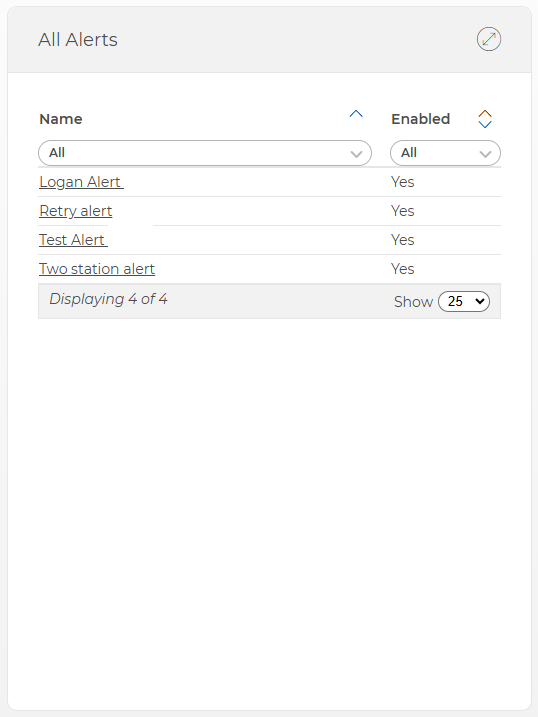
Each alert shows:
- Name - The name of the alert. Click an alert name to go to the corresponding Alert Detail page.
- Enabled - Whether the alert is enabled or disabled (Yes or No).
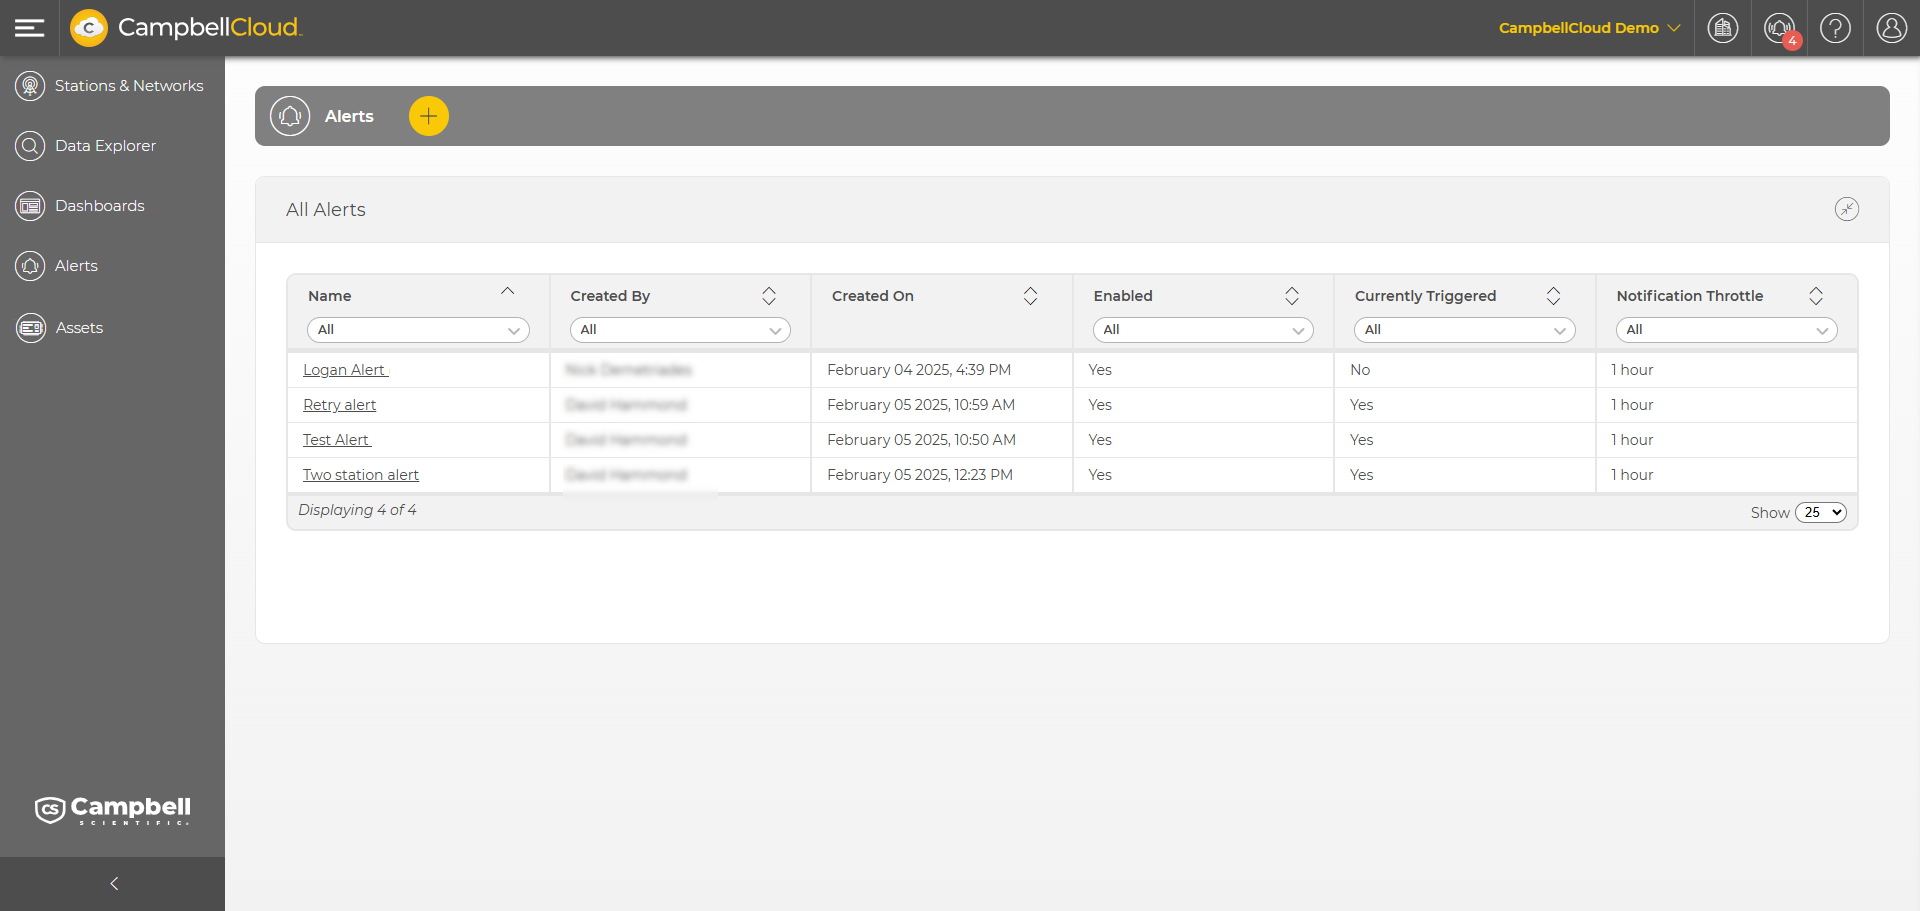
When the All Alerts panel is expanded, it shows a table with the following columns:
- Name - The name of the alert. Click an alert name to go to the corresponding Alert Detail page.
- Created By - The name of the user who created the alert.
- Created On - The date the alert was created.
- Enabled - Whether the alert is enabled (Yes or No).
- Currently Triggered - Whether or not the alert is currently triggered.
- Notification Throttle - How often notifications will be sent for the same trigger conditions. If the same trigger conditions are met multiple times during the throttle window, only one notification will be sent.
Alert notifications throughout CampbellCloud
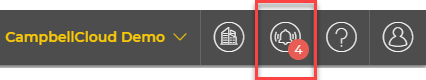
Alerts will also be visible in other locations such the action bar. Click the Alerts notification on the action bar to see all current alerts:
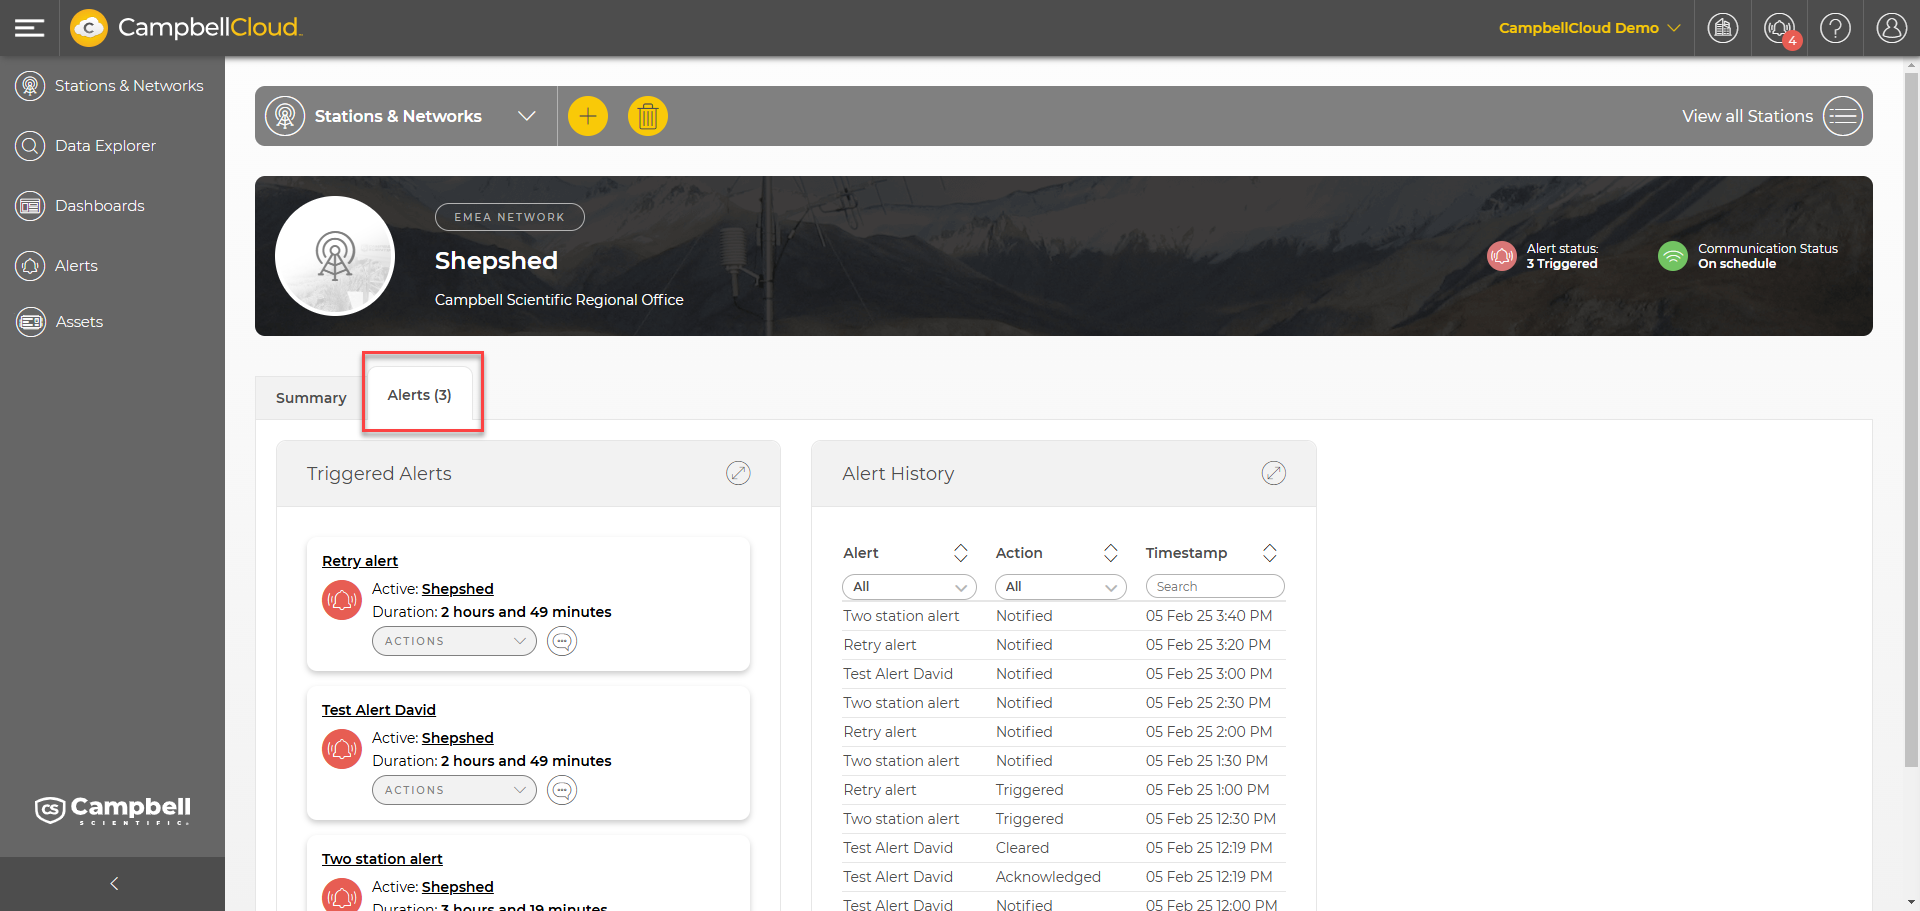
Alerts are also visible in the Stations & Networks application. A column in the table view shows the number of active alerts for each station:
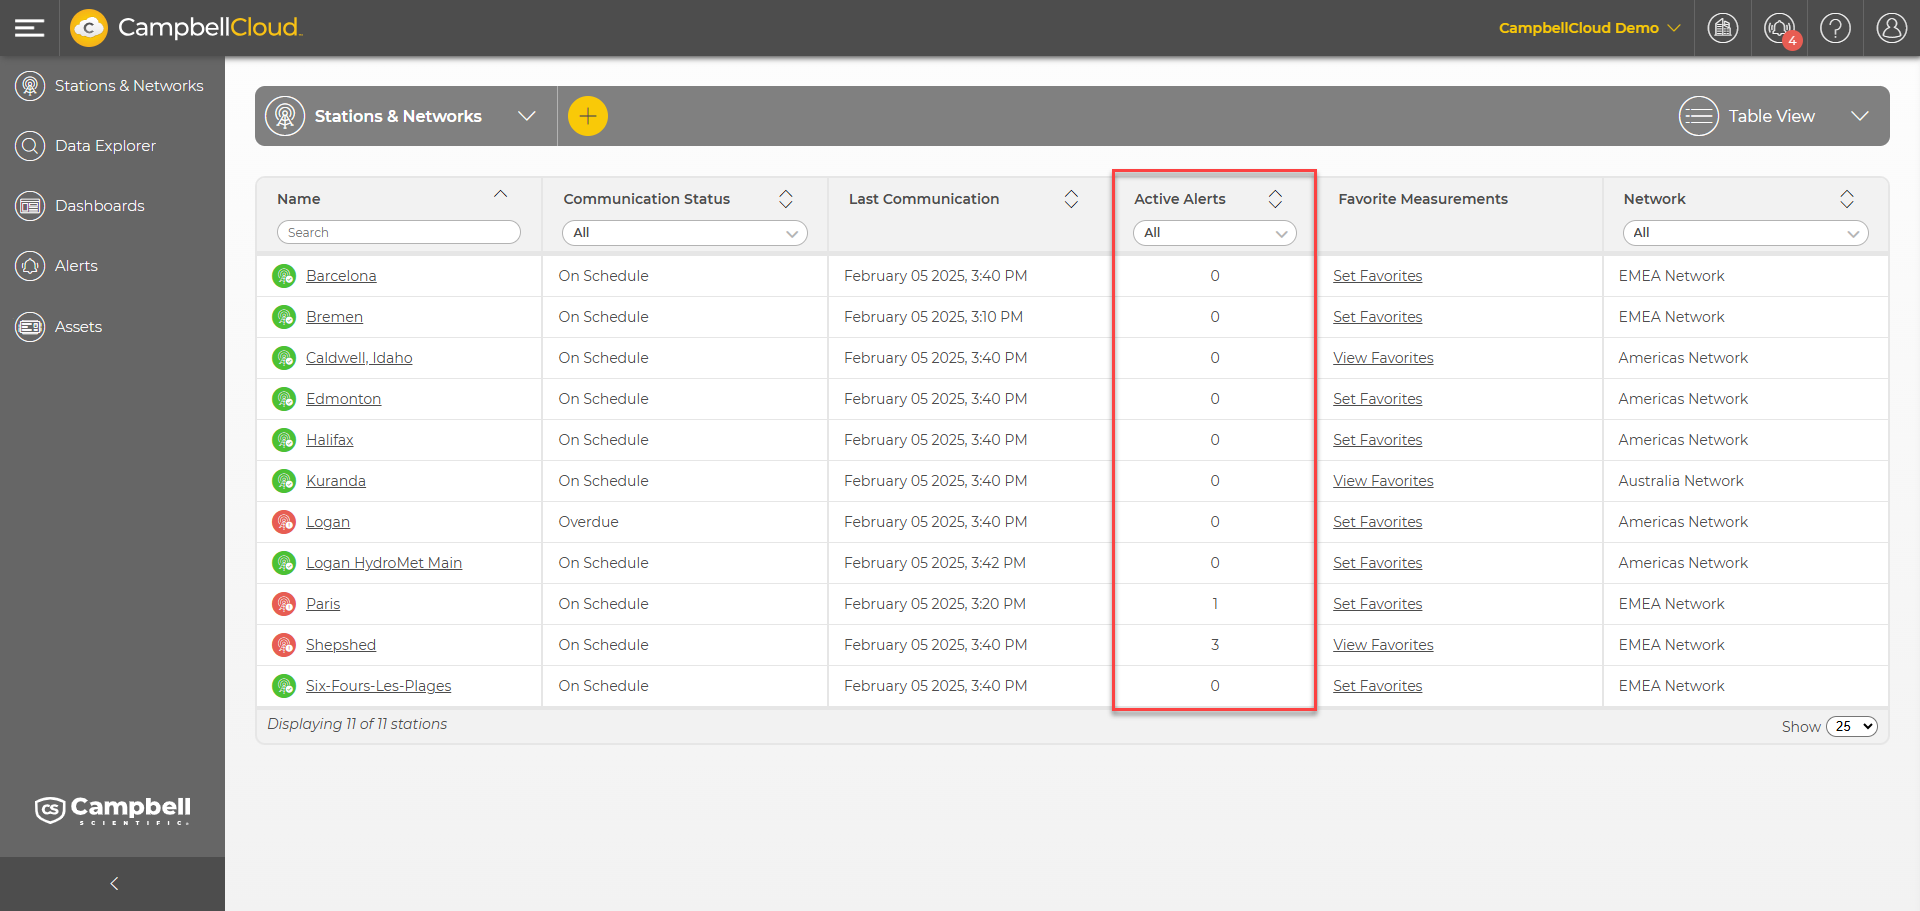
Click on a station to be taken to the station summary. From there, click on the Alerts tab to show the triggered alerts and the alert history for that station.