Rainflow Histogram
From the Rainflow Histogram screen, you can view rainflow histogram data. The Rainflow Histogram button on the toolbar will be enabled if there is at least one valid rainflow histogram in the currently selected data file.
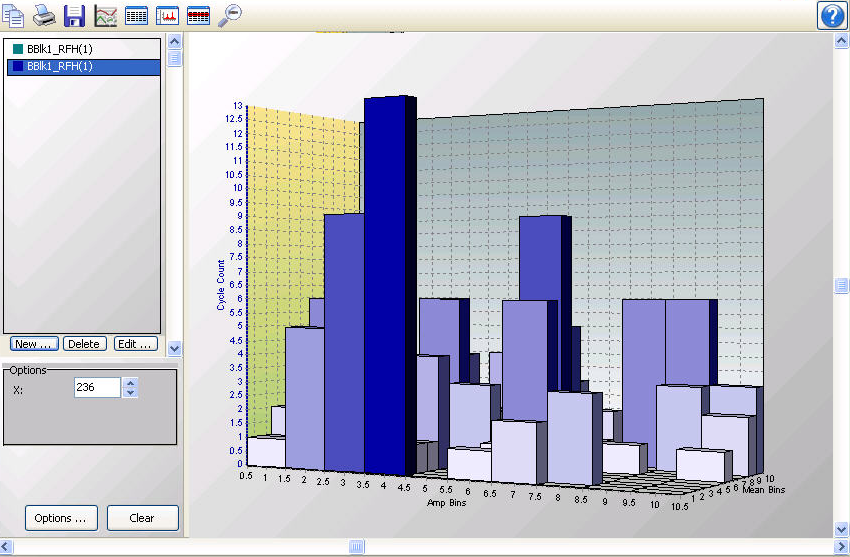
A rainflow histogram is a 3D representation based on the rainflow counting algorithm of Endo and Matsuishi which was first published in 1968. These diagrams can be used to monitor fatigue levels of structures under stress such as components of a large bridge.
NOTE: View Pro does not create rainflow histogram data from time series information. It only displays rainflow histogram data contained in a *.DAT file. Rainflow histogram data in a *.DAT file is created by using the CRBasic Rainflow instruction in a CRBasic program Data Table.
Multiple Rainflow Histogram screens can be created.
Selecting Data to be Viewed
From a Rainflow Histogram Screen
When a Rainflow Histogram screen is first opened with no rainflow histogram records selected in the data file, the Rainflow Histogram Setup dialog box will open which allows you to set up the Rainflow Histogram. The first option is a drop-down list that shows the available rainflow histograms in the currently selected data file. Select the rainflow histogram that you would like to view. The second option allows you to choose which record of the rainflow histogram you would like to view initially. Type in a number directly or use the arrow keys to the right of the box to change the value.
This dialog box can also be opened from a button,  , on the Rainflow Histogram toolbar. This allows you to change the options for the rainflow histogram record that is selected in the list on the left side of the Rainflow Histogram screen.
Additional rainflow histogram records can be added by pressing the New button. (These additional records can be from either the same rainflow histogram or a different rainflow histogram in your data file.) You can then choose which rainflow histogram record is being displayed by selecting it in the list.
From the Data Grid
You can also select rainflow histogram records directly from a data file to be displayed on a Rainflow Histogram screen. Clicking on any data value in a rainflow histogram record will select that rainflow histogram record. Rainflow histogram records can be selected before the Rainflow Histogram screen is opened with the Selected Graph set to None. When the Rainflow Histogram screen is opened, all selected rainflow histogram records will be listed on the left side of the Rainflow Histogram screen. A rainflow histogram record can then be displayed by clicking on it in the list. Once the Rainflow Histogram screen is opened, additional rainflow histogram records can be added to the Rainflow Histogram screen by selecting them in the data file as described above.
NOTE: All rainflow histogram records from the same rainflow histogram will have the same default name in the list. They can be distinguished by the colored boxes next to their names. Each box is the same color with which that rainflow histogram record is highlighted in the data file. It is also the color with which that rainflow histogram record is displayed. The color associated with a histogram record can be changed from the Selection Properties dialog box. (The Selection Properties dialog box is opened by clicking on the rainflow histogram record in the list and then pressing the Edit button.)
New
Brings up the Rainflow Histogram Setup dialog box to allow you to add a new rainflow histogram record to the display.
Delete
Deletes the selected rainflow histogram record from the Rainflow Histogram.
Edit
Brings up a dialog box to set properties for the selected rainflow histogram record. This dialog box can be used to set properties for Display (name, color, marks) and Axes (scaling, limits, and title).
Options
X
Indicates which record of the rainflow histogram is being viewed. The arrow buttons can be used to scroll through records of the rainflow histogram.
Options
Brings up the Options dialog box for the Rainflow Histogram. This dialog box can be used to set options for chart colors, margins, and the chart title.
Clear
Press this button to clear all rainflow histogram records contained in the Rainflow Histogram.
Zoom Feature
You can zoom in on a particular area of a Rainflow Histogram by holding the left mouse button and dragging the mouse pointer from top-left to bottom-right (or bottom-left to top-right) over the area to be zoomed. Pressing the Undo Zoom toolbar icon  or dragging the mouse pointer from bottom-right to top-left (or top-right to bottom-left) will undo the zoom.
You can also zoom in and out by using the Page Down and Page Up buttons on your keyboard.
Rotating the Rainflow Histogram
You can rotate the Rainflow Histogram by using the scroll bars at the bottom and right of the Rainflow Histogram.
Right-Click Menus
Right-clicking on the graphical display area will bring up a menu from which you can choose Export to save the Rainflow Histogram in a choice of formats, Copy to Clipboard to place the Rainflow Histogram on the clipboard, Print to print the Rainflow Histogram, or Options to bring up the Rainflow Histogram’s Options dialog box.
Right-clicking on a rainflow histogram record in the list above the New, Edit and Delete buttons brings up a menu from which you can choose Edit Selection to bring up the Selection Properties dialog box, Delete Selection to delete the selection from the graph, or Selection Summary to see information about the rainflow histogram record, the data file, and the datalogger and program that generated the data file.
Rainflow Histogram Toolbar Icons
The Rainflow Histogram includes the following toolbar icons:
|
|
Copy to Clipboard. Places the Rainflow Histogram graphic on the Windows clipboard. It can then be pasted into other applications. |
|
|
Print. Prints the Rainflow Histogram. Print options can be set before printing begins. |
|
|
Export. Allows the Rainflow Histogram to be exported in a choice of text or graphical formats. |
|
|
Graph Options. Opens a dialog box from which you can set properties for the Rainflow Histogram including scaling, colors, margins, titles, etc. This dialog box can also be brought up by pressing the Options button. |
|
|
Show Table. Brings the main View Pro window in front of other windows, making the data file(s) visible. |
|
|
Show/Hide Gradient. A toggle button that turns on and off the gradient background of the Rainflow Histogram. It may be useful to hide the gradient, when printing the Rainflow Histogram. |
|
|
Modify Selection. Brings up the Rainflow Histogram Setup dialog box from which you can change the options for the selection. |
|
|
Undo Zoom. Returns the Rainflow Histogram to its original state after zooming. |


