Trace Options—Display
Trace Options allows you to control how the trace will look on the graph.
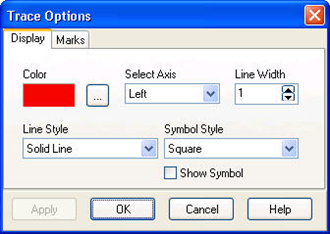
Color - Displays the color currently selected for the trace. Press the button to the right of the color square to display a color palette from which to select a new color.
Select Axis - Use the drop-down list box to choose whether to plot the trace on the left or right axis.
Line Width - Use the arrows to the right of the field to increase or decrease the width of the line that will represent the data value.
Line Style - Use the drop-down list box to select the style for the line that will represent the data value.
Symbol Style - Use the drop-down list box to select the symbol that will represent each data point.
Show Symbol – Determines whether symbols are displayed for this data value. Select the check box to have symbols displayed. If the check box is cleared, no symbols will be displayed.