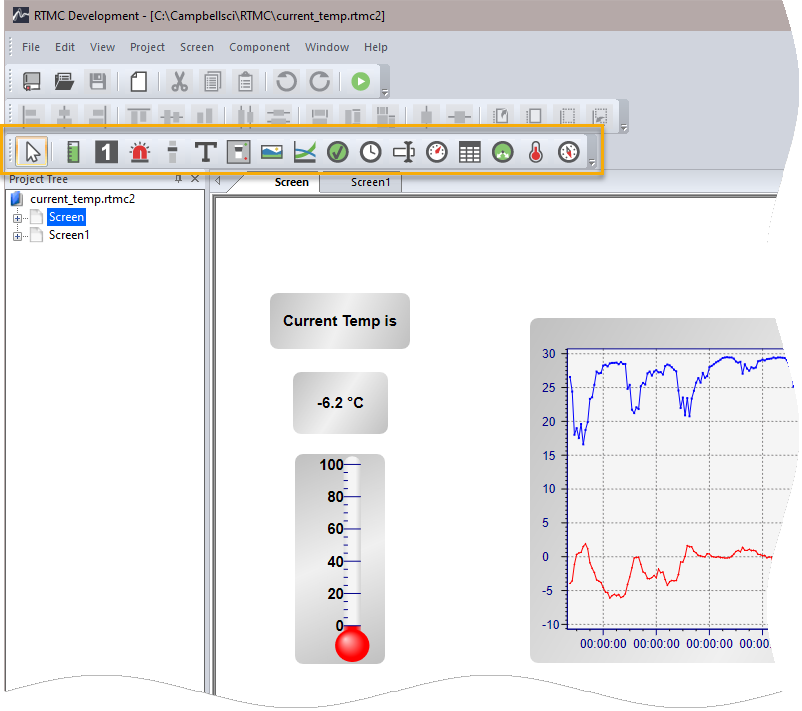
Component Toolbox
Components are the objects that are used to display data and create the graphical layout of the project. To add a component to the Workspace, click on an item in the Component Toolbox, then click anywhere in the Workspace. The component's Properties window is automatically displayed when the component is first placed in the Workspace. The Properties window is used to set colors, scale values, define text, etc., and to assign the data value to be displayed by the component.
After a component's properties have been set, select OK to apply the changes and close the Properties window. Once closed, the Properties window can be displayed by double-clicking the component. If you make changes to a component's properties but then decide to reject those changes, press the Cancel button to return the properties to the last applied state. If Cancel is selected when a component is first placed in the Workspace (and OK has not been pressed), the component will be removed from the screen.
NOTE: In LoggerNet, RTMC displays data from the data cache (and not from a collected data file). Data must be collected from the datalogger for the data cache to be updated, and therefore, for the RTMC displays to be updated. Typically this is done by setting up a schedule in LoggerNet's Setup window. Data displays will be updated no more frequently than data is being collected from the datalogger.
NOTE: In RTDAQ, when RTDAQ is connected to the datalogger, RTMC performs a manual poll every second to update project data. Therefore, RTDAQ must be connected to the datalogger for the RTMC displays to be updated.
NOTE:  An exclamation point in a red circle at the upper right of a component indicates a problem with the linked data value. Hover your mouse pointer over the box for a few seconds to display a hint about the error RTMC has detected.
NOTE:  A yellow N in a red circle at the upper right of a component indicates the value of the field referenced in the Select Data field of the component is currently a NaN.
The following components are available in RTMC.
|
|
|
|
|
|
|
Returns the cursor to a normal selection tool. |
|
|
Status Bar |
Depicts the selected data value as a single vertical bar. |
|
|
Digital |
Depicts the selected data value as a numeric value, text string or Boolean. |
|
|
Alarm |
Provides visual and/or audible notification that a data value has exceeded a defined limit. An audible alarm can be silenced by right-clicking the component with your mouse and selecting Acknowledge Alarm. |
|
|
Slider |
Depicts the selected data value as a single horizontal bar. The data value can also be set to a new value by dragging the slider. |
|
|
Label |
Displays a text string that can be used to label other components. |
|
|
Switch |
Indicates the state of a port, flag, input location, or public variable. A 0 is considered Off (false); any non-zero number is considered On (True). In run-time mode, right-click a switch to change its state. The option to change the state of a switch with a single-click or a double-click can be enabled in the Properties window. |
|
|
|
Allows you to place a static image on the display. |
|
|
Chart |
Displays one or more time domain series on a chart. The time stamp on the X axis reflects the data timestamp. |
|
|
Comm Status Alarm |
Provides a visual and/or audible alarm when scheduled collection is disabled in the Setup Screen, the schedule is paused from the Status Monitor, or communication has failed a sufficient number of times to put the datalogger into a Primary or Secondary Retry mode (the retry mode used is based on the Sensitivity property for the component). An audible alarm can be silenced by right-clicking the component with your mouse. Note that if RTMC is launched from RTDAQ, a Comm Status Alarm will only be triggered when an RTDAQ real-time display is started or stopped. This is because RTDAQ uses scheduled collection to temporary collect areas in order to update the real-time displays. |
|
|
Time |
Depending upon the option chosen, displays the server time, server time at last data collection, station time, station time of last record stored, PC time, or a time stored in the data tables (such as time of maximum or minimum). |
|
|
Set Point |
Like the Digital component, depicts the selected data value as a numeric value, text string or Boolean. However, in run-time mode, a data value can also be set to a new value by double-clicking the component and entering a new value in the resulting dialog box. |
|
|
Gauge |
Displays the selected data value on a gauge. |
|
|
Table Display |
Displays the data from a datalogger table in a row and column format. |
|
|
|
Reads a value in a datalogger and writes to another value in that datalogger or a different datalogger. The value that is written can be the value read, a 0 or -1, or a specified constant. Note that in RTDAQ, RTMC projects are limited to a single station. Therefore, the value read can only be forwarded to another value in the same datalogger. |
|
|
|
Displays the data value on the image of a thermometer. |
|
|
|
Provide an eight-point compass on which to display data. |


NOTE: A description of each field in a component's Properties box can be displayed by pressing F1 or clicking the help button (?) in the top right-hand corner of the dialog box while your mouse cursor is within the box.
Expressions
Components that display data values either numerically or graphically can be processed using mathematical expressions. For instance, a temperature reading in degrees Celsius can be processed to display in degrees Fahrenheit using a mathematical expression. For a list of functions and operators that are supported, see
NOTE: When referencing data from separate tables within the same expression, the