PakBus Graph
PakBus Graph is a utility that graphically depicts the connections in a PakBus datalogger network. In PakBus graph, the PC400 software server is, by default, assigned PakBus address 4093, the RTDAQ software server address 4090, and the LoggerNet software server address 4094. Each of the PakBus dataloggers that have been configured will be shown by name and address.
Static and Dynamic Links
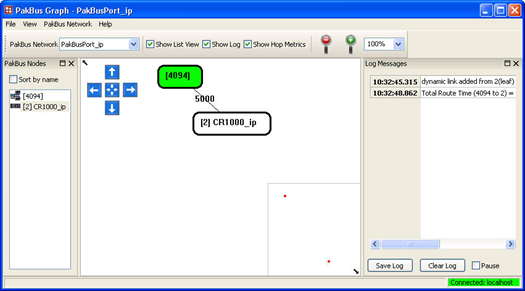
There are two types of links to PakBus dataloggers that the server recognizes: static links and dynamic links. Static links (depicted using red lines) are the communication links to dataloggers that have been set up in the software, but which have not been confirmed by communicating with the datalogger(s). You will see these dataloggers listed in the software's network map. Dynamic links (black lines) are communication links to dataloggers that have been confirmed. You may also see links to leaf node dataloggers that have not been set up in the software, but which the server has "learned about" by activity within the PakBus network.
Connecting to the Software Server
When PakBus Graph is opened in LoggerNet Admin or LoggerNet Remote, you will be prompted for the address of the server with which to connect and a user name and password:
Server Address - This is the TCP/IP address of the computer running LoggerNet software, to which you are trying to connect. This must be the valid name of an existing computer or a TCP/IP address (in the form ###.###.###.### consisting of the IP network number, ###.###.###, and the host number, ###). If the software server resides on the same computer as PakBus Graph, you can simply type in LocalHost for the server name.
User Name - Your user name on the LoggerNet server.
Password - Your password for the LoggerNet server.
NOTE: The User Name and Password fields are required only if security has been set up on the software server to which you are trying to connect.
Each time you start PakBus Graph, you will be prompted to enter this information. However, you can save the login information by selecting the Remember User Name and Password check box, or you can select the Automatically log in with this information check box to skip this window and use the information from the last session.
NOTE: You do not have the option of selecting a server when PakBus Graph is opened in RTDAQ, PC400, or the standard version of LoggerNet. The connection is always to LocalHost.
Selecting the PakBus Network to View
By default, each of the software server's PakBus networks (comprised of the dataloggers attached to a specific PakBus Port) is independent from the other networks. Each network is displayed individually in PakBus Graph. To select the network to view, select the PakBus Port from the PakBus Network list box.
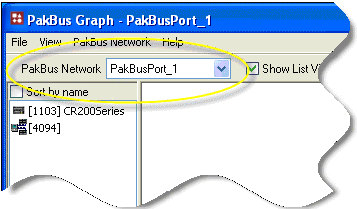
The software server can also be set up with "bridged" PakBus ports. In this case, every datalogger attached to every PakBus port is part of the same network. If the PakBus ports have been bridged, the resulting single port will be named "__global__" and it will be the only selection in the PakBus Network list.
Software servers are identified in PakBus Graph by the color green![]() . Other devices remain colorless unless they have been selected with the mouse cursor. When selected, they are colored cyan
. Other devices remain colorless unless they have been selected with the mouse cursor. When selected, they are colored cyan![]() .
.
The network map will change as new devices are discovered or known devices fall out of communication with the network. When the network map is redrawn, devices may be displayed in a new position on the screen. To make the network easier to read, you can reposition the devices on the screen by dragging them to a new location. Once a device is moved, it is "locked" into position and the outside border will be shown with a heavier line than an "unlocked" device. The locked position of a device will be maintained between PakBus Graph sessions. You can unlock a device by right-clicking it and choosing Unlock Position or you can unlock all devices in the network by selecting View | Unlock All Positions from the menu. 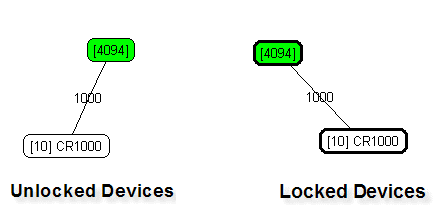
PakBus Graph Configuration
PakBus Graph can be set up to show one or all of the following informational objects. By default, they are all displayed when PakBus Graph is opened. (If changes have been made to this default view, you can select View | Restore Default View to return to the default view.)
Select the Show List View check box to display a list of the PakBus devices on the left side of the graph window. Clear the check box to remove the list. By default, devices are displayed in this list in numerical order. You can sort the list by name in alphabetical order by selecting the Sort by Name check box.
Select the Show Log check box to display a log of PakBus communication messages on the right side of the graph window. The time will be displayed indicating when each message was sent to or received from the datalogger.
When the Show Hop Metrics check box is selected, the graph will include the time, in milliseconds, that communication takes to each device. You can also click a device, and then click a second device, to retrieve the communication time between the two devices. The results are displayed in the Log Messages portion of the window.
Viewing/Changing Settings in a PakBus Datalogger
If you right-click a device in PakBus graph, you will be presented with a floating menu. From this menu, select Edit Settings to display a list of the PakBus settings for the datalogger. Some of these settings are read-only, but other settings can be changed. Click within the cell for a setting, enter a new value and then press return to make a change.
NOTE: Pressing F5 with the Settings window open will refresh the Settings table.
Right-Click Functionality
There are several options available from the floating menu that is displayed when you right-click a device (not all devices will have all settings):
Edit Settings - This option shows the PakBus settings of a device (see above).
Ping Node - This option will send a packet to the selected device to determine if it is reachable in the PakBus network. The results of the ping will be displayed in the Log Messages. Each ping message will include the size of the packet sent, and the time of response from the pinged device. The last message recorded will include summary information from the ping.
Verify Routing Table - This option will request the routing table from the highlighted PakBus device.
Reset Node - This option will reset the routing table in a PakBus device.
Change PakBus Address - By default, the PakBus address of the software server is 4093 (PC400), 4090 (RTDAQ), or 4094 (LoggerNet). This option lets you change this default.
Search for Neighbors - When this option is selected, the software server will broadcast a Hello Request every 5 seconds to search for PakBus neighbors with which it can communicate. During this time, the PakBus port is kept on-line.
NOTE: PakBus Graph will continue searching for neighbors until the Stop button is pressed or the Search for Neighbors window is closed. This is because there is no way to predict how long it may take to find neighbors.
Broadcast Reset - This option will reset the routing table in the selected PakBus device, as well as any neighbors of the selected device that are acting as routers.
Unlock Position - This option will unlock a device that has been locked into position in PakBus Graph by dragging it to a new position on the screen. All devices can be unlocked by selecting View | Unlock All Positions from the menu.
Discovering Probable Routes
You can view the probable route between two devices by sequentially clicking on the two devices in Pakbus Graph. The probable communication route will be highlighted in cyan. If the Show Hop Metrics check box is selected, the graph will include the time, in milliseconds, that communication takes between the two devices. The results are also displayed in the Log Messages portion of the window.
Scrolling
The PakBus Graph network map window is designed so that it has no real boundaries. Rather than using traditional scroll bars, PakBus Graph provides two means of changing the viewing window: the scroll buttons and the model overview. In addition to these features, you can scroll the viewing window directly using the mouse.
Using the Scroll Buttons
Navigation buttons that can be used to scroll the network map window are highlighted in the image below.
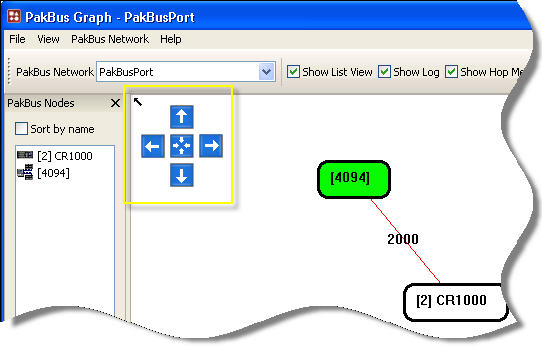
The following buttons and features are associated with this control:
Arrow Buttons—Pressing any arrow button will scroll the window in the direction of the arrow.
Center Button—Pressing the center button will reposition the window at the graph origin.
Collapse Button—The small black arrow in the upper left hand corner of the scroll button area allows you to hide the navigation buttons. When this is done, the black arrow will remain but point in the opposite direction and, if clicked on, will expand the scroll button area.
Using the Model Overview
The model overview is a small square area in the lower right hand corner of the window. The positions of devices in the window are represented with red dots. A black rectangle is used within this area to show the current viewing area. If you click the left mouse button while the pointer is anywhere within this area, the window will be scrolled so that the center of the window is positioned relative to the mouse position within the overview area. If you depress the left mouse button and drag the mouse pointer, the window will be scrolled as you move the mouse. If you click on the small black arrow on the lower left hand corner of the overview area, most of the area will be hidden although the arrow will remain with a reversed direction. Pressing the arrow will make the model overview area visible again.
Using the Mouse
You can scroll the network map window by holding down the left mouse button while the mouse pointer is over a blank area of the window and dragging the mouse in the desired direction.