Drawing Canvas
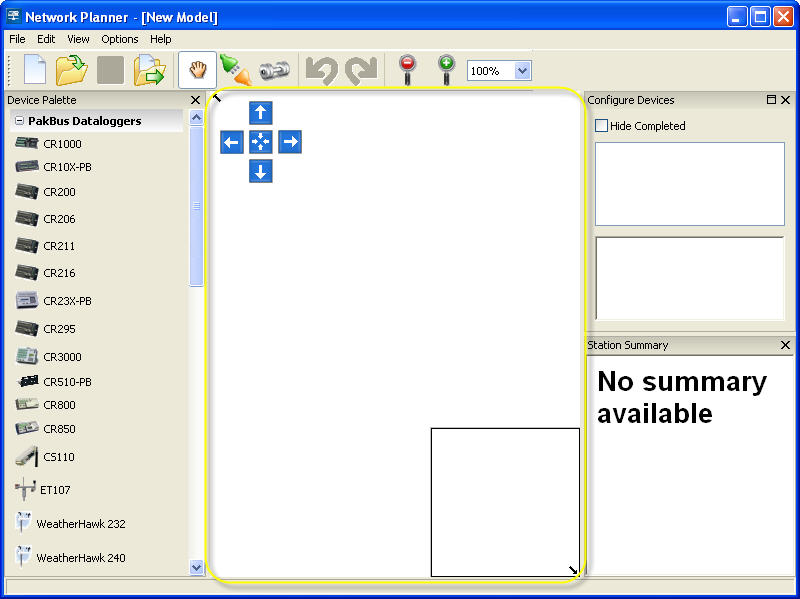
The Drawing Canvas is the large section in the center of the Network Planner window that is highlighted in the figure below. As stations are added to the network, they are placed on the drawing canvas. As links are added between stations, they are indicated on the drawing canvas as lines between the stations.
Adding a Background Image
A background image can be associated with the model by using the Options | Change Background Image menu item. If you select this menu item, a file selection dialog will be shown and you will be allowed to select a bitmap image file for the background. Alternatively, the background image can be pasted from the clipboard using the Options | Paste the Background Image menu item. This item will only be enabled if there is an image object on the clipboard. You can clear the background image by selecting the Options | Clear the Background Image menu item.
Any source for images files can be used for the background image. One example is Google Earth™. You can save a Google Earth™ image to your clipboard by choosing Edit | Copy Image from the Google Earth™ menu. Then select Options | Paste the Background Image from the Network Planner menu to copy the background image from the clipboard to the Network Planner background.
Background images offer significant value in that they allow you to see the layout of your network related to the geography that you are trying to cover. A good image can show landmarks and/or topographical locations that guide placement of things like radio repeaters. That said, the Network Planner does not derive any intelligence from the background image. It is present strictly to satisfy user aesthetics.
Scrolling the Drawing Canvas
The drawing canvas is designed so that it has no real boundaries. Rather than using traditional scroll bars, the Network Planner provides two means of changing the canvas viewing window: the scroll buttons and the model overview. In addition to these features, when stations are selected in the Station Device List, the canvas will be scrolled so that the selected station is visible. Finally, you can scroll the canvas directly using the mouse.
Using the Scroll Buttons
Navigation buttons that can be used to scroll the model canvas are highlighted in the image below.
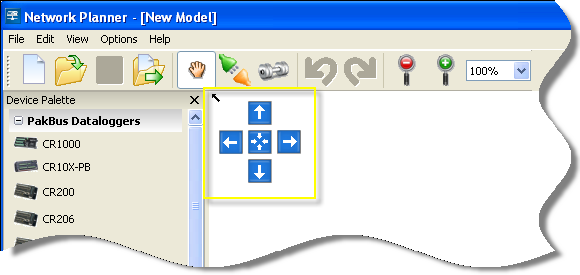
The following buttons and features are associated with this control:
-
Arrow Buttons—Pressing any arrow button will scroll the drawing canvas in the direction of the arrow.
-
Center Button—Pressing the center button will reposition the drawing canvas at the graph origin.
-
Collapse Button—The small black arrow in the upper left hand corner of the scroll button area allows you to hide the navigation buttons. When this is done, the black arrow will remain but point in the opposite direction and, if clicked on, will expand the scroll button area.
Using the Model Overview
The model overview is a small square area in the lower right hand corner of the canvas. If a background bitmap is associated with the model, a miniature version of that bitmap will appear in the overview. The positions of stations on the canvas are represented with red dots. A black rectangle is used within this area to show the current viewing area. If you click the left mouse button while the pointer is anywhere within this area, the canvas will be scrolled so that the center of the canvas is positioned relative to the mouse position within the overview area. If you depress the left mouse button and drag the mouse pointer, the canvas will be scrolled as you move the mouse. If you click on the small black arrow on the lower left hand corner of the overview area, most of the area will be hidden although the arrow will remain with a reversed direction. Pressing the arrow will make the model overview area visible again.
Using the Station Device List
If the station list is shown and you select a station in this list, that station will be selected in the drawing canvas. If the station is not currently visible at that time, the canvas will be scrolled until the station is shown on the canvas.
Using the Mouse
While the Hand Tool is selected by pressing the hand icon on the toolbar, you can scroll the drawing canvas by holding down the left mouse button while the mouse pointer is over a blank area of the canvas and dragging the mouse in the desired direction.
Changing the Canvas Scale
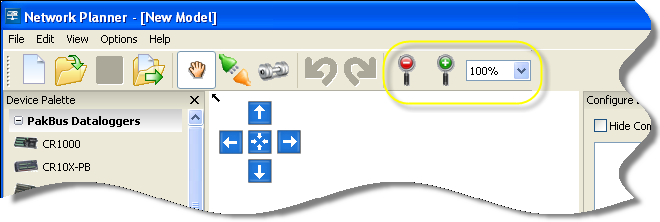
The scale of the drawing canvas can be changed using the toolbar controls highlighted in the above figure. The red button with the minus symbol decreases the zoom factor and the green button with the plus symbol increases the zoom factor. The combo-box to the right of these buttons allows the zoom factor to be selected directly. The Network Planner expresses zoom factors as percentages and supports 25%, 50%, 100%, 125%, 150%, 200%, 400%, 800%, 1600%, 3200%, and 6400%.