Using Data Table Monitor
Data Table Monitor is a utility that was created to retrieve data from the LoggerNet server data cache and display it on the screen. It also has the option to export it to a file. Once the utility has been started, as new records are collected by the server, the new records will be displayed and sent to the file.
The most important use of Data Table Monitor is to see what records are being stored in the data cache and to diagnose suspected data cache problems.
Data Table Monitor gets all the data available from the data cache that matches the export conditions. As the server collects new records from the datalogger, they are automatically displayed and sent to the data file. This continues until Data Table Monitor is closed or data export is stopped.
WARNING: One caution about the data file created by Data Table Monitor—there are no limits to size or longevity. If you plan to use the export to file feature on a regular basis, make sure to either restart Data Table Monitor (which overwrites the exported file) or delete the files periodically. The data export can easily be restarted by clicking the Start button. This will delete the old file and start a new one.
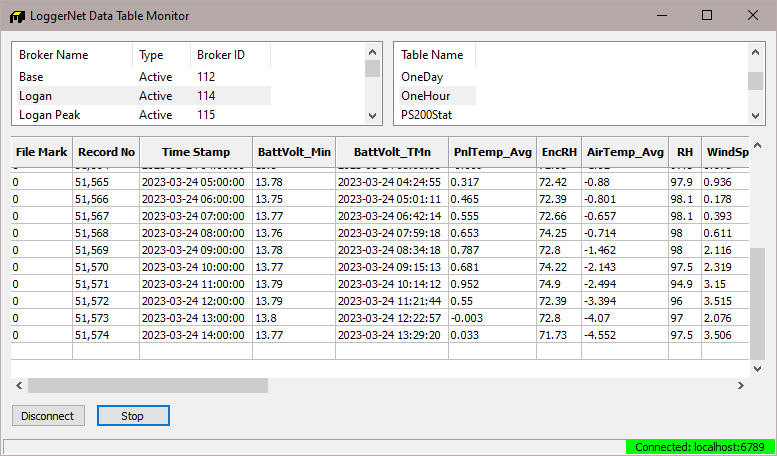
To start Data Table Monitor open Windows Explorer and got to the C:\Program Files (x86)\Campbellsci\LoggerNet directory. Double click the Tablemon2.exe file. The utility will start with a screen similar to the one shown below.
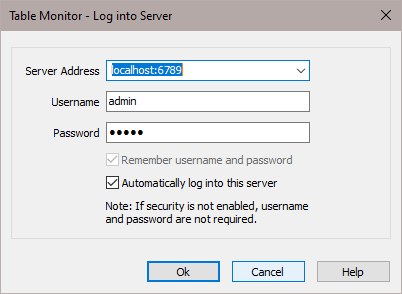
If Data Table Monitor does not automatically connect to the LoggerNet server, click the Connect button to connect to the server. The dialog box shown below will be displayed. If you are working on the same computer where LoggerNet is running leave the default Server Address as localhost. The Server Port (default is 6789) should be appended to the Server Address separated by a colon. The Username and Password are only used with versions of LoggerNet that support security. To connect to LoggerNet on another computer, enter the computer network name (or IP address) and port number in the Server Address. When you click OK a list of the dataloggers in the network will be shown in the upper left window.
Selecting a datalogger will list the names of the data tables or array IDs in the datalogger. Note that if data collection has not been set up and enabled in the Setup Screen, no data will be coming into the data cache. Data Table Monitor can only display and output data from the data cache. Data Table Monitor displays and outputs all the data points from an array or table.
Click the Start button to bring up the Start Advise Options dialog. This dialog gives you choices about which records to display and the data file in which to store them.
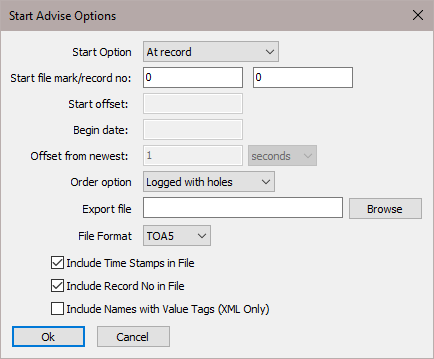
Start Option: This selects the starting point for the data to be displayed and output to the file.
-
At Record: This option allows a selection of starting position based on the file mark and record number. An entry of 0 in both fields will get all of the data in the data cache.
-
At Time: This option allows a selection of the starting position based on the timestamp in the data. The time and date are set in the Begin Date field. All of the records available after this timestamp are output.
-
At Newest: This option will set the starting position to the last record stored in the data cache. This last record and any future records stored will be output.
-
After Newest: This option will set the starting position to be the next record stored in the data cache. Output begins with the next record stored in the data cache. No historical records will be output.
-
Relative to Newest: This option starts from the most recent record collected. The Offset from Newest specifies how much time to go back from the current write index. For example, an offset of 10 with a setting of minutes will get the last 10 minutes of data collected.
-
At Offset from Newest: This option allows you to specify how many records back from the current write index to go. A setting of 10 in the Start Offset box will display the last 10 records collected.
-
The Start File Mark, Start Record Number, Start Offset, Begin Date, and Offset from Newest edit boxes are used only with the corresponding start options above. For each option selected, the appropriate boxes are enabled.
Order Option:
-
Collected: displays and writes the data to the file in the order it was collected by the server. This setting is useful to look at the actual data record storage in the data cache.
-
Logged With Holes: The output will include only complete data sequences. If the Data Table Monitor comes to a hole that has not yet been filled, it will wait for the hole to fill before displaying or writing the next record to the file.
-
Logged Without Holes: The data output will be displayed and written to file as quickly as it is collected, without waiting for holes to be filled. Any data in holes will be skipped in the output.
-
Real Time: the most recent data is always sent out starting with the last record stored. This will not provide a complete data set.
Set the output file directory and name in the Export File box. The Browse button will bring up a Windows Save As dialog box to select the file name and directory.
File Format:
-
TOACI1 – Data is stored in a comma separated format. Header information for each of the columns is included.
-
TOA5 – Data is stored in a comma separated format. Header information for each of the columns is included, along with field names and units of measure if they are available.
-
TOB1 (binary) – Data is stored in a binary format. Though this format saves disk storage space, it must be converted before it is usable in other programs.
-
XML – Data is stored in XML format with Campbell Scientific defined elements and attributes. For additional information, refer to Appendix B, Campbell Scientific File Formats (p. B-1).
Once the start options have been set, click the OK button to start. The records are displayed in the list box on the bottom of the screen. If you have set up an output file they are also sent to the output file.