Graphs
Real-time data and final storage data can be plotted on LoggerNet's graphs. There are three displays that can be set up with up to 12 different data points each. The data values will be graphed on the y-axis against their timestamps on the x-axis.
NOTE: Timestamp and RecNum are special field names used by a Graph to display the timestamp and the record number. If TimeStamp or RecNum is used as a variable name in your program, that variable cannot be displayed on a Graph.
NOTE: The timestamps on input locations for mixed-array dataloggers are a combination of the time retrieved from the datalogger and LoggerNet’s date. With even a slight difference between the LoggerNet clock and the datalogger clock, this can result in data that is incorrectly timestamped for data points close to midnight. This incorrect timestamp can cause the graphical display to stop, because the timestamp of subsequent data is older than the timestamp of the last data plotted. If you see this occurring, adjust the datalogger clock to be equal to or slightly ahead of the PC clock.
NOTE: Some settings (Selected Fields, Graph Width, right-click menu) may be changed while a graph is running. However, when graphing very fast data, the response time for changes to take effect will always be better, if the graph is stopped before attempting to change the settings.
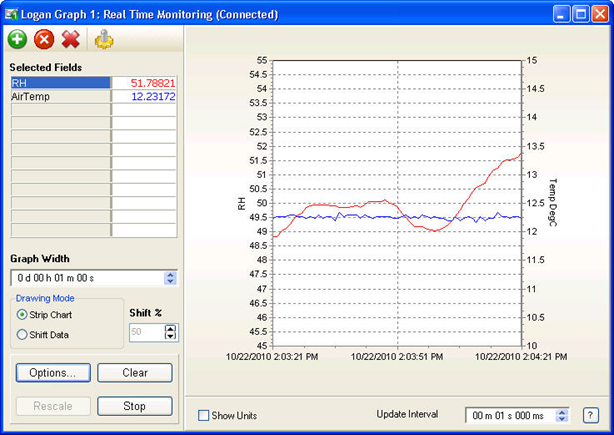
Selected Fields - To select the fields to graph, press the Add ( ) button. All tables will be displayed. Highlight any table to show the available fields in that table. Select fields to graph by highlighting a field and then pressing paste or dragging and dropping fields onto the Selected Fields table. Fields can be removed by highlighting the field name and then pressing the Delete (
 ) button. All fields can be removed be pressing the Delete All (
 ) button. Pressing the Trace Options (
 ) button with a trace selected will bring up the Trace Options dialog box that allows you to set the color and appearance of that trace.
Graph Width - Set the amount of time to be displayed on the graph in hours, minutes, seconds and milliseconds. Type in the numbers directly or use the arrow keys to increase or decrease graph width. The minimum graph width is 1 millisecond.
Drawing Mode - Choose the Drawing Mode for the graph. The choices are Strip Chart or Shift Data. In Strip Chart mode, the data will stream across the graph. After the graph is filled, the oldest points will fall off the left edge of the graph as new points are added to the right edge. If Shift Data is chosen, the data will be positioned in a static location. Once the graph is filled, the data on the graph will be shifted over. The size of this shift and, therefore, the amount of data that will be removed from the graph is determined by the percentage specified in the Shift % field.
Options - Brings up the Options dialog box for the graph. This dialog box can be used to set options for scaling, data display, visual display, and NAN values. A graph configuration can also be saved or loaded from the dialog box.
Rescale - Press this button to scale all of the data points so they fit within the graph axis. This button is available only if Powers of 10 scaling is being used for the graph.
Clear - Press this button to clear the data contained in the graph and continue graphing with a fresh screen.
Start/Stop Button - Press the Start button to begin the graphing of data for the selected field(s). When data is being graphed, the text on this button will change to Stop, and it can be pressed to stop the retrieving and graphing of data.
Show Units – Select this check box to display any units that have been assigned to data values being displayed.
Update Interval – Specifies how often data in the graph will be updated. Note that data can be updated no faster than the data values are being generated by the datalogger.
The arrow to the right of the Add/Delete/Delete All/Trace Options buttons can be pressed to hide the settings pane and allow more room for the graph. The arrow button will change direction and can then be used to restore the settings pane.
Right Click Menu Options
Pressing the right mouse button will bring up a short cut menu relative to where your mouse pointer is on the graphical display.
Right Click Within the Graph - Displays a short cut menu with items for saving, printing, and formatting the graph:
Save As - Allows you to save a picture of the current graph in a BMP or WMF format.
Copy - Save a copy of the current graph image to the Window's clipboard. This copy can then be pasted into another application.
Options - Opens the Graph Display Options dialog box.
Clear - Erases the existing traces on the graph.
Rescale – Scales the data values so they are all displayed within the graph boundaries. This option is available only when Powers of 10 Scaling is chosen for the graph.
Start/Stop - Starts the graphing of data when a graph is currently stopped. Stops the retrieving and graphing of data, when a graph is currently running.
Print Preview - Displays a preview of the printed page with the ability to set the paper orientation, page margins, and other print properties.
Print - Brings up the standard windows Print dialog box so that the graph can be printed.
View Statistics - Displays the average value, minimum, maximum, and number of data points for each data value being displayed. (Note that these values are for the default graph view, i.e. not zoomed or panned.)
Right Click on a Table Cell - Displays a short cut menu with options specific to traces.
Add - Brings up the Add Selection dialog box from which you can add a trace to the graph.
Delete - Removes the trace from the graph.
Rename - Sets the name of the field to a state in which it can be edited.
Do Not Plot - Stops the trace from being plotted on the graph. A check mark appears beside the Do Not Plot menu item for a trace that will not be plotted. Record numbers and timestamps are not plotted.
Delete All - Resets all settings for the traces on the graph. This will remove all traces from the graph.
Select All - Selects all traces on the graph. This allows options for all traces to be set at once.
Show Symbol – Determines whether symbols are displayed for this data value. (Symbols are set from the Trace Options dialog box.)
View/Modify Value - Displays the value in a separate dialog box and allows you to change the value (if it is editable).
Trace Options - Displays a dialog box that lets you set the color and appearance of the trace.
Help - Brings up help for the Graph.
Additional Capabilities
Vertical Line Marker
Double-clicking a point on the graph will bring up a vertical line marker on the screen that moves with the cursor. As the vertical bar is moved across the graph, the Selected Fields box will display the data value(s) corresponding to the timestamp of the vertical marker. (If a vertical line marker is brought up while graphing is underway, the graph will be automatically paused. It will be necessary to push Start to resume graphing.)
Zoom and Scroll
An area of the graph can be zoomed in on by using the mouse pointer to draw a box around the area to be viewed. (Place the mouse cursor in the area for the upper left of the box, press the mouse button, and hold and drag the mouse pointer to the desired bottom right corner of the box.) To return to normal view, press the Undo Zoom button in the upper right corner of the graph. (You may also press the mouse button, hold and drag the mouse pointer up and to the left to return to normal view.)
If you have stopped a graph and zoom in to a region, you can use the right mouse button to drag the screen and thus scroll to other locations of the graph at the current zoom level.