Graph Display Options—Visual Display
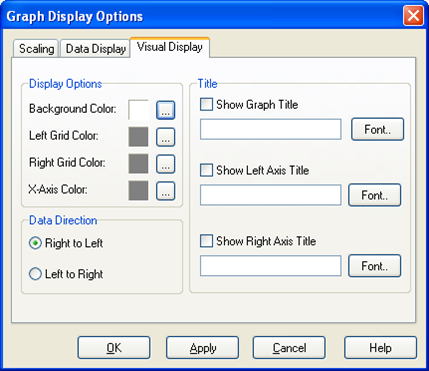
The Visual Display tab of the Graphing Options dialog box is used to set colors, titles, and data direction for the graph.
Once the graph options are set, press Apply or OK to make the changes. (If Apply is pressed, the dialog box remains open. If OK is pressed, the dialog box is closed.) Press Cancel to remove any changes that have not yet been applied.
Display Options - Press the browse button ( ) to the right of each field to display a color palette from which to choose a custom color for the graph element. The grid colors are the grid lines for the left and right axes.
Data Direction - Choose whether the traces are displayed on the graph from Right to Left (newest data is displayed on the right side of the graph) or Left to Right (newest data is displayed on the left side of the graph).
Title - Enter a title that will be centered over the top edge of the graph and for each axis.
Show Title - Select this check box to display the specified title. Clear the check box to remove it.
Font - Press this button to display a font dialog box from which you can select a font for the specified title.