Graph Display Options—Scaling
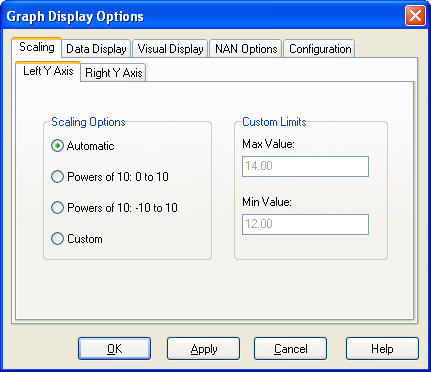
The Scaling tab of the Graphing Options dialog box is used to set scaling options for the axes of the graph. Choose the tab corresponding to the axis for which you wish to set the scale (Left Y-Axis or Right Y-Axis).
Once the graph options are set, press Apply or OK to make the changes. (If Apply is pressed, the dialog box remains open. If OK is pressed, the dialog box is closed.) Press Cancel to remove any changes that have not yet been applied.
Scaling Options
Automatic Scaling - LoggerNet will automatically adjust the Y axis scale so that all traces are displayed on the graph.
Powers of 10: 0 to 10 - Data values will be scaled so that they fit on a graph ranging from 0 to 10. Negative values will not be displayed. Each trace is scaled based on its maximum value. If that value is greater than 10, all of the points in the series are repeatedly divided by 10 until the maximum value is less than or equal to 10. If the maximum value is greater than 0 but less than or equal to 1, all of the points in the series are repeatedly multiplied by 10 until the maximum value is greater than 1. Note that scaling occurs when the Apply button is pressed on the dialog box. Rescaling does not automatically occur if the maximum value goes out of the range. However, you may press the Rescale button to recalculate the scale at any time.
Powers of 10: -10 to 10 - Data values will be scaled so that they fit on a graph ranging from -10 to 10. Each trace is scaled based on its maximum and minimum values. If the maximum value is greater than 10 or if the minimum value is less than -10, all of the points in the series are repeatedly divided by 10 until the maximum value is less than or equal to 10 and the minimum value is greater than or equal to -10. If all of the points in the series are greater than or equal to -1 and less than or equal to 1, all of the points in the series are repeatedly multiplied by 10 until the at least one value is outside that range. Note that scaling occurs when the Apply button is pressed on the dialog box. Rescaling does not automatically occur if the values go out of the range. However, you may press the Rescale button to recalculate the scale at any time.
Custom - Lets the user specify an upper and lower value for the Y axis. The graph will not display traces that fall outside of the specified limits.
Custom Limits - These fields (Max Value and Min Value) are used to enter an upper and lower value for the Y axis. These fields are disabled if Custom is not selected as the Scaling Option.