Graph Display Options—NAN Options
The NAN Options tab of the Graph Display Options dialog box is used to specify how NAN (Not-A-Number) values will be represented in the graph.
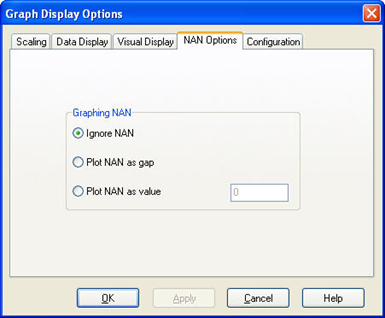
Once the graph options are set, press Apply or OK to make the changes. (If Apply is pressed, the dialog box remains open. If OK is pressed, the dialog box is closed.) Press Cancel to remove any changes that have not yet been applied.
Ignore NAN - If this option is selected, the NAN is not represented on the graph. There will be one continuous line in which the data points adjoining the NAN values will be bridged
Plot NAN as gap - When this option is selected any NAN value in the data will be represented by a discontinuity. This means that the data points on either side of the NAN will not be connected by a line. There will be breaks in the line for each NAN in the data.
Plot NAN as value - With this option is selected, each NAN value in the data will be represented by the specified value.