Graph Display Options—Data Display
The Data Display tab of the Graphing Options dialog box is used to set options determining how data is displayed in the graph.
Once the graph options are set, press Apply or OK to make the changes. (If Apply is pressed, the dialog box remains open. If OK is pressed, the dialog box is closed.) Press Cancel to remove any changes that have not yet been applied.
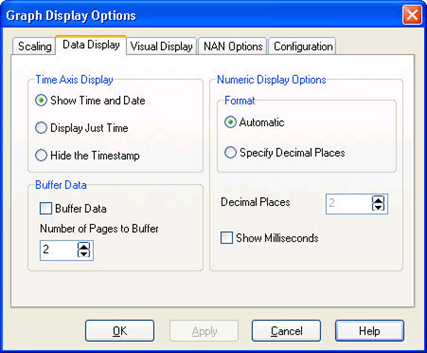
Time Axis Display - These options affect the format of the timestamp for the bottom axis of the graph. You can choose to Show Time and Date, Display Just Time, or Hide the Timestamp.
Numeric Display Options - Select Automatic to have the number of decimal places determined automatically by the data value. Select Specify Decimal Places to specify how many decimal places will be shown in the Decimal Places field. Check the Show Milliseconds check box to show milliseconds for the timestamp. Clear the check box to omit milliseconds on the timestamp display.
Buffer Data - Determines whether data coming into the graph is buffered. Select the Buffer Data check box to buffer data. Clear the check box to prevent data from being buffered.
The amount of data to be buffered is specified in the Number of Pages to Buffer field. Each page will contain the amount of data specified by the Graph Width.
When the Buffer Data option is on, a stopped graph can be scrolled backward in time for the amount of pages specified. The paused graph will have arrows which appear to facilitate moving backward or forward one page at a time, moving to the earliest page, or moving to the latest page. You can also manually navigate through the buffered data by right-clicking and dragging to move backward or forward in time.