QuickReports Setup
The QuickReports Setup window comes up automatically after a new data source has been selected. At other times, it can be opened to edit an existing report by selecting Edit > QuickReports Setup from the menu or by right-clicking on the chart and selecting QuickReports Setup. It can be opened to create a new report by selecting File > New Report from the menu.
This window allows you to designate a title for your report, select the data table that will be used for the report, select the columns of data that will be displayed, and select the date range that will be displayed.
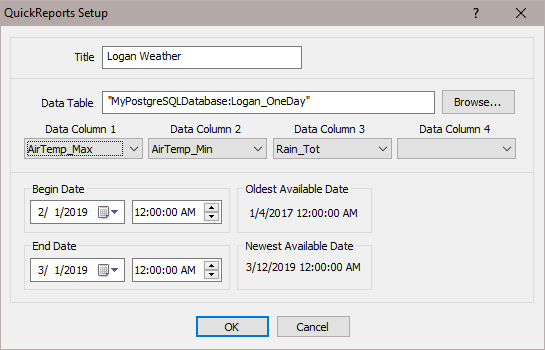
Title
Specify the title to be displayed at the top of the report.
Data Table
Indicates the data table from which to display data values. Use the Browse button to open the Data Source Browser and select a table.
Data Column 1 – Data Column 4
Use the drop-down lists to select up to 4 data values to be displayed. (Note that you can add more data values later. See Customizing Your Report.)
Begin Date/End Date
Enter the Begin Date/Time and End Date/Time to specify the time period for which data will be displayed. The Oldest Available Date and Newest Available Date fields indicate the date range that is in the table and able to be displayed.
By default, the Data Grid can display a maximum of 5000 records. If your selected date range exceeds 5000 records, you will only see 5000 records in the Data Grid with a note at the bottom indicating “Max Records Exceeded”. In order to view all of the records in your date range, you will need to use the Data Grid’s property sheet to increase Max Records. (See Customizing Your Report for more information on using property sheets to customize your report.)
When using the QuickReports Setup window to edit the date range for a report, you will lose any customization you have done to chart traces. If you wish to maintain the customization, you should edit the date range using the Report Range property sheet.