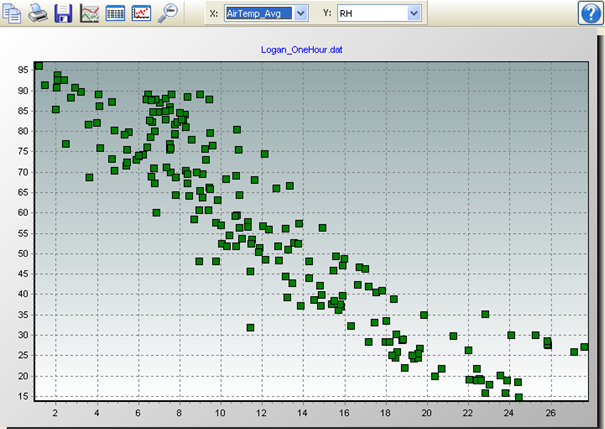
XY Plot
From the XY Plot screen, you can graph a data value on the y-axis against a different data value on the x-axis. The user specifies what will be used for both the X axis data value and the Y axis data value. Each Y axis data value is plotted against the X axis data value with the identical timestamp.
Multiple XY Plot screens can be created.
Selecting Data to be Plotted
To select the data values to be plotted, click the column headings in the data file with a single mouse click. The selected columns will be highlighted and will be added to the XY Plot in both the X and Y drop-down lists. Select from the X and Y drop-down lists the values to be used for the X axis and Y axis, respectively.
New
Adds another series to the XY Plot. The X and Y values for the new series can then be selected from the X and Y drop-down list boxes.
Delete
Deletes the selected series from the XY Plot.
Edit
Brings up a dialog box to set properties for the selected series. This dialog box can be used to set properties for symbols and marks.
Zoom Feature
You can zoom in on a particular area of an XY Plot by holding the left mouse button and dragging the mouse pointer from top-left to bottom-right (or bottom-left to top-right) over the area to be zoomed. Pressing the Undo Zoom toolbar icon  or dragging the mouse pointer from bottom-right to top-left (or top-right to bottom-left) will undo the zoom.
Right-Click Menu
Right-clicking on the graphical display area will bring up a menu from which you can choose Export to save the XY Plot in a choice of formats, Copy to Clipboard to place the XY Plot on the clipboard, Print to print the XY Plot, or Options to bring up the XY Plot’s Options dialog box.
Right-clicking on a series in the list above the New, Edit and Delete buttons brings up a menu from which you can choose Edit Series to bring up the Series options dialog box or Delete Series to delete the series from the XY Plot.
XY Plot Toolbar Icons
The XY Plot includes the following toolbar icons:
|
|
Copy to Clipboard. Places the XY Plot graphic on the Windows clipboard. It can then be pasted into other applications. |
|
|
Print. Prints the XY Plot. Print options can be set before printing begins. |
|
|
Export. Allows the XY Plot to be exported in a choice of text or graphical formats. |
|
|
Graph Options. Opens a dialog box from which you can set properties for the XY Plot including colors, margins, titles, scaling, etc. |
|
|
Show Table. Brings the main View Pro window in front of other windows, making the data file(s) visible. |
|
|
Show/Hide Gradient. A toggle button that turns on and off the gradient background of the XY Plot. It may be useful to hide the gradient, when printing the XY Plot. |
|
|
Undo Zoom. Returns the XY Plot to its original state after zooming. |


