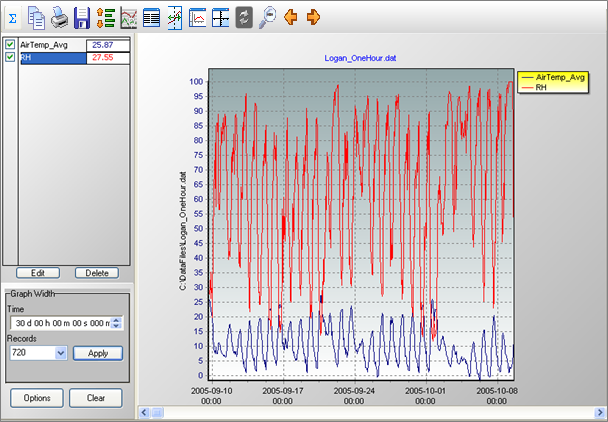
Line Graph
From the Line Graph screen, you can graph data values on the y-axis against their timestamps on the x-axis.
Multiple Line Graph screens can be created.
Selecting Data to be Graphed
To select the data value(s) to be graphed, click the column heading(s) in the data file with a single mouse click. The selection will be highlighted and will automatically be added to the
A partial column can be added by dragging the mouse pointer over the desired values. (Note that once a partial column is selected, it can be extended by holding the Shift key and clicking at a point below the current selection. The selection will be extended to that point.) Multiple partial columns can be added by holding the Ctrl key and dragging the mouse pointer over the desired values.
Data from multiple data files can be displayed in a single graph. This is done by opening multiple data files and selecting data to be graphed as described above. This may be useful when comparing data from multiple datalogger stations.
Creating Multiple Line Graphs
To open an additional Line Graph, select “None” from the Selected Graph drop-down menu on the main View Pro toolbar. The highlighting in the data file will be cleared. Select the data that you would like graphed as described above and then press the Line Graph button. A new Line Graph will be created with your selection(s) graphed. You may then continue adding selections to the Line Graph as described above.
An unlimited number of Line Graphs can be opened using this same process.
You can navigate between multiple graphs by clicking on a graph or by choosing a graph from the Selected Graph drop-down list on the View Pro toolbar and pressing the Bring the selected graph to the front button.
NOTE: The highlighted selections in the data files will always indicate the values being graphed in the currently selected graph.
Edit
Brings up a dialog box to set properties for the selected trace. (A trace is selected by clicking its name in the list above the Edit and Delete buttons.) This dialog box can be used to set properties for Display (name, color, line width, line style, and symbol style), Y Axis (scaling, limits, and title), and Marks.
Delete
Deletes the selected trace from the graph. (A trace is selected by clicking its name in the list above the Edit and Delete buttons.)
Graph Width
The Graph Width can be set either as a function of time or number of records.
NOTE: If the Graph Width Time or Records field is changed, when the Apply button is pressed, the other field will automatically be changed correspondingly.
NOTE: The number of Records to be displayed cannot be set to a number less than two. If a number less than two is entered, it will automatically be changed to two, when the Apply button is pressed.
Time
The amount of time that will be shown on the graph in days, hours, minutes, seconds and milliseconds. Each element (days, hours, minutes, seconds, and milliseconds) can be highlighted separately. Once an element is highlighted, type in the desired value or use the arrow keys to increase or decrease. After entering the desired value, press the Apply button to make the change take effect.
Records
The number of records that will be shown on the graph. Highlight the field and then type in the desired value or click on the arrow to pick a value from the drop-down list. After entering the desired value, press the Apply button to make the change take effect
Options
Brings up the Options dialog box for the graph. This dialog box can be used to set options for chart colors, margins, title, legend, points, and plotting options (line only, points and line, points only).
Clear
Press this button to clear all traces and data contained in the graph.
Zoom Feature
You can zoom in on a particular area of a Line Graph by holding the left mouse button and dragging the mouse pointer from top-left to bottom-right (or bottom-left to top-right) over the area to be zoomed. Pressing the Undo Zoom toolbar icon  or dragging the mouse pointer from bottom-right to top-left (or top-right to bottom-left) will undo the zoom.
Scrolling Through the Graph
You can scroll through the graph by using the scroll bar at the bottom. You can also use the Page Up and Page Down buttons on your keyboard to scroll through the graph a Graph Width at a time.
Scrolling the graph will scroll the data on the data panel as well. Conversely, scrolling through a data panel will also scroll the
Graph scrolling can be disabled by pressing the Lock Scrolling icon  on the toolbar. The icon will change to
  . Pressing the icon again will re-enable scrolling. When locked, the graph will not scroll. However, moving the scroll bar on either the graph or the data file will still scroll the data file.
Right-Click Menus
Right-clicking on the graphical display area will bring up a menu from which you can choose Export to save the graph in a choice of formats, Copy to Clipboard to place the graph on the clipboard, Print to print the graph, or Options to bring up the graph’s Options dialog box.
Right-clicking on a trace name in the list above the Edit and Delete buttons brings up a menu from which you can choose Edit Selection to bring up the trace options dialog box, Delete Selection to delete the selection from the graph, Selection Summary to see information about the trace, the data file, and the datalogger and program that generated the data file, Assign to Left Axis to show the selected trace’s scale on the left y-axis, Assign to Right Axis to show the selected trace’s scale on the right y-axis, Check All to check all traces and make them visible on the graph, Uncheck All to uncheck all traces and remove them from the graph . (See Common vs. Independent Y-Axes for more information on the y-axes.)
Line Graph Toolbar Icons
The Line Graph includes the following toolbar icons:
|
|
Statistics. Displays statistics for each trace including Average, The Statistics button is disabled when a graph is in a zoomed state. |
|
|
Copy to Clipboard. Places the graphic on the Windows clipboard. It can then be pasted into other applications. |
|
|
Print. Prints the graph. Print options can be set before printing begins. |
|
|
Export. Allows the graph to be exported in a choice of text or graphical formats. |
|
|
Lock Scrolling. Locks and unlocks the scroll bar at the bottom of the graph. When unlocked, moving the scroll bar on either the graph or the data file will scroll both the graph and the data file. When locked, the graph will not scroll. However, moving the scroll bar on either the graph or the data file will still scroll the data file. This is a toggle button. When the lock is currently enabled, there will be a lock on top of the icon. |
|
|
Graph Options. Opens a dialog box from which you can set properties for the graph including colors, margins, titles, legend, etc. This dialog box can also be brought up by pressing the Options button. |
|
|
Show Table. Brings the main View Pro window in front of other windows, making the data file |
|
|
Show/Hide Graph Cursor. A toggle button that shows and hides the graph cursor. The graph cursor is a vertical line extending from the top to the bottom of the graph display. When visible, you can click and drag the cursor across the graph. Data values at the current cursor position will be shown in the table. Timestamp at the current cursor position will be shown in the status bar. |
|
|
Show/Hide Gradient. A toggle button that turns on and off the gradient background of the graph. It may be useful to hide the gradient, when printing the graph. |
|
(Common) |
Common/Independent Axes. When multiple data values are being graphed, determines whether they have common y-axes or independent y-axes. When using common y-axes, one scale will apply to all traces assigned to the left y-axis and one scale will apply to all traces assigned to the right y-axis. |
|
(Independent) |
When using independent y-axes, the scale shown on each y-axis will apply only to the last selected trace assigned to that axis. (A trace is selected by clicking on its name in the list above the Edit and Delete buttons.) Refer to Common vs. Independent Y-Axes for more information. |
|
|
Synchronize Axes. Only enabled when data is being graphed from multiple data files and all of the data files have an overlapping time period. When a graph contains traces from multiple data files, a box with a drop-down list will appear in the Graph Width options box. The data file chosen from the drop-down list indicates which data file and graph will be scrolled by the graph scroll bar. After using the scroll bar to scroll the indicated graph, the Synchronize Axes button may be pressed to synchronize the timestamps of the remaining graph(s) and data file(s) so that they are all displaying data from the same time period. |
|
|
Undo Zoom. Returns the graph to its original state after zooming. |

|
Jumps the graph to the position showing a full screen of data ending with the last record on the right-most part of the graph. |

|
Jumps the graph to the position showing a full screen of data beginning with the first record on the left-most part of the graph. |


