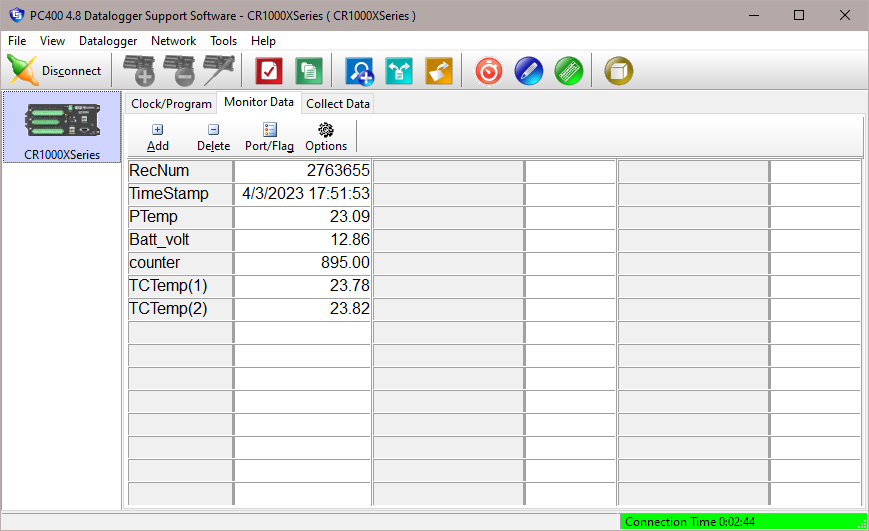
Monitor Data Tab
The Monitor Data tab displays the current measurement values (i.e., input locations or public variables) and final storage data for the datalogger. This window can also be used to monitor or set ports and flags in the datalogger.
Monitoring Values
When the Monitor Data tab is first opened for a datalogger, values from the Public or Input Location table are displayed. Final storage table values can also be added to the Monitor. Press the Add button to display a window with a list of all tables in the datalogger program. When a table is highlighted, the data values for that table are displayed in the field on the right. Choose one or more values from the list and press the Paste button to add them to the Monitor. You can also add values to the Monitor by dragging and dropping them to the desired location.
NOTE: For mixed-array dataloggers, if you see 28 default input locations listed in the monitor and do not see a list of the tables when the Add button is pressed, you will need to associate a program with the datalogger. This is accomplished by using the Associate Program button on the Clock/Program tab.
One or more values can be removed from the Monitor Data tab by highlighting the value(s) and pressing the Delete button. Values can be moved to different cells by dragging and dropping them.
The values of input locations (or variables) and the state of ports and flags can be changed from the Monitor Data tab. To edit an input location value, double-click the displayed value, enter the new value, and press the Enter key. When a value is enabled for editing, if the ESC key is pressed, the change will be canceled. The state of a port or flag can be changed by clicking the LED icon to the right of the field value. A black LED indicates that the port or flag is low; green indicates that it is high.
The font size on the Monitor Data tab cannot be changed directly. However, you can drag a corner of the PC400 window to resize it. This will also cause the Monitor Data tab font to be resized to correspond to the new window size.
Monitoring and Controlling Ports and Flags
When the Port/Flag button is selected, a window appears displaying the ports and flags in the datalogger.
The state of a port or flag can be changed by clicking the LED icon to the left of the field label. A black LED indicates that the port or flag is low; green indicates that it is high. Custom labels can be assigned to the ports and flags by double-clicking within the label field and typing in a new label.
Program variables that are declared as Boolean can also be placed on this display, for dataloggers that support data types. For these dataloggers, an Add button is available that, when pressed, lists all of the tables in the datalogger. When a table is highlighted on the left side of the window, any variables that are declared as Boolean in the program will be displayed on the right side of the window.
Our current dataloggers do not have predefined flags. The first time a program is sent to the datalogger, PC400 will look for a Public array with the name of Flag in the program. If a Flag array is found, the declared flags will be added to the Ports and Flags dialog box. The number of flags that will be added is limited by the number of cells available on the Ports and Flags display. Ports that can be toggled from this display will be displayed in the first column and the remaining cells will be available to display flags and other Boolean values in the program.
To return the Ports and Flags display to its original state, press the Defaults button. This will reset all labels to their original names, update the number of flags based on the currently running program, and remove any Boolean values placed on the screen.
Right Click Menu Options
Pressing the right mouse button while in a name field in the Ports and Flags window will bring up a short cut menu with the following options:
Add - Adds a new Boolean value to the window.
Delete - Deletes the selected value.
Rename - Allows you to rename the selected value.
Save Configuration- Saves the Ports and Flags configuration to a file that can be loaded in the future.
Load Configuration- Loads a previously saved Ports and Flags configuration file.
NOTE: If a Flag array has been declared and subsequently aliased, it will no longer show up on the Ports and Flags display by default. However, if it has been declared as Boolean, it may still be added manually.
NOTE: A control port must first be configured for output in the datalogger program before it can be toggled on or off. Consequently, if you select a port and it doesn't appear to change, your program may not have the port configured for output (refer to your datalogger operator's manual).
NOTE: A Boolean variable is a variable that can have one of two states: high/low, off/on, -1/0, true/false. Variables can be declared as Boolean with the Public or Dim statement.
Options
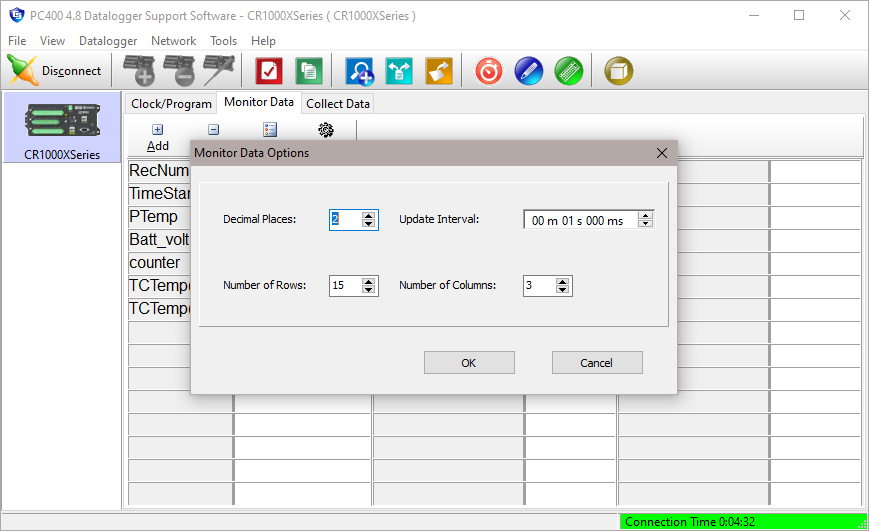
Decimal Places
The number of decimal places displayed for the values on the Monitor Data tab is controlled by the Decimal Places field. Use the up and down arrows to the right of the field to increase or decrease the number of decimal places, or type a value directly into the field.
Update Interval
For mixed-array dataloggers, input locations will be updated based on the interval specified in the Update Interval field. Final Storage Locations may also be viewed on the Monitor Data tab, but they will be updated only when data is collected from the datalogger.
For table-based dataloggers, both public variables and final storage data will be updated based upon the interval specified in the Update Interval field.
NOTE: Measurement and final storage values can be updated on the Monitor Data tab no more quickly than they are updated in the datalogger program.
Number of Rows
Determines the number of rows viewed. Use the arrows to the right of the field, or type in a number directly, to specify this value. The maximum number of rows is 100.
Number of Columns
Determines the number of columns viewed. Use the arrows to the right of the field, or type in a number directly, to specify this value. The maximum number of columns is 10.