Vibrating wire measurements
The data logger can measure vibrating wire sensorsVibratingwire() instruction in CRBasic, orVibratingWire() instruction. See the CRBasic Help for details.
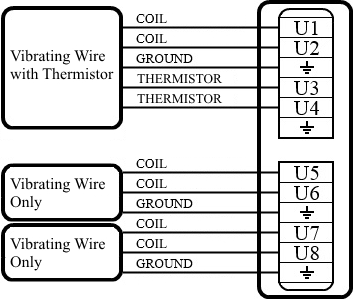
The following image provides some examples for connecting vibrating wire sensors to the CR6. You can use the Short Cut software to create a program and display a wiring diagram for most types of vibrating wire sensors. Access the vibrating wire measurement in Short Cut through the Generic Measurements sensors folder. Short Cut also has measurements for specific sensor models in the Geotechnical & Structural and Water > Level & Flow folders.
VSPECT™
Measuring the resonant frequency by means of period averaging is the classic technique, but Campbell Scientific has developed static and dynamic spectral-analysis techniques (![]() VSPECT ™ A registered trademark for Campbell Scientific's proprietary spectral-analysis, frequency domain, vibrating wire measurement technique.) that produce superior noise rejection, higher resolution, diagnostic data, and, in the case of dynamic VSPECT, measurements up to 333.3 Hz. For detailed information on VSPECT, see Vibrating Wire Spectral Analysis Technology
VSPECT ™ A registered trademark for Campbell Scientific's proprietary spectral-analysis, frequency domain, vibrating wire measurement technique.) that produce superior noise rejection, higher resolution, diagnostic data, and, in the case of dynamic VSPECT, measurements up to 333.3 Hz. For detailed information on VSPECT, see Vibrating Wire Spectral Analysis Technology ![]() .
.
The data logger uses an audio ![]() ADC Analog to digital conversion. The process that translates analog voltage levels to digital values. to capture vibrating wire signals on U terminals. Noise frequencies may be sourced from harmonics of the natural frequency, electronic noise, or harmonics of the electronic noise. For example, 50 Hz or 60 Hz noise from ac mains grid power and associated harmonics are common noise sources. Noise frequencies may also originate from mechanical obstruction of the taut wire, such as may be caused by a loose wire or when the wire vibration is physically changed by sensor movement. VSPECT makes possible the separation of the natural-resonant frequency from these other frequencies.
ADC Analog to digital conversion. The process that translates analog voltage levels to digital values. to capture vibrating wire signals on U terminals. Noise frequencies may be sourced from harmonics of the natural frequency, electronic noise, or harmonics of the electronic noise. For example, 50 Hz or 60 Hz noise from ac mains grid power and associated harmonics are common noise sources. Noise frequencies may also originate from mechanical obstruction of the taut wire, such as may be caused by a loose wire or when the wire vibration is physically changed by sensor movement. VSPECT makes possible the separation of the natural-resonant frequency from these other frequencies.
The ![]() FFT Fast Fourier Transform. A technique for analyzing frequency-spectrum data. algorithm requires time for computation. Compile or download errors will occur if the CRBasic program does not allow two seconds for the measurement of each sensor.
FFT Fast Fourier Transform. A technique for analyzing frequency-spectrum data. algorithm requires time for computation. Compile or download errors will occur if the CRBasic program does not allow two seconds for the measurement of each sensor.
VSPECT diagnostics
The following diagnostics indicate the condition of a vibrating wire sensor:
- Decay ratio
- Signal-to-noise ratio
- Low signal strength amplitude warning
- Invalid voltage-supply warning
Decay ratio
“Decay” is the dampening of the wire vibration over time. The decay ratio is calculated as:
Some sensors will decay very rapidly. A good practice is to characterize sensor decay and amplitude when a sensor is new; so, the health of the sensor can be monitored over time.
Signal-to-noise ratio
The signal-to-noise ratio is calculated as:
Low signal strength amplitude warning
When the response amplitude is measured as less than 0.01 mV ![]() RMS Root-mean square, or quadratic mean. A measure of the magnitude of wave or other varying quantities around zero., the Resonant Frequency value reports
RMS Root-mean square, or quadratic mean. A measure of the magnitude of wave or other varying quantities around zero., the Resonant Frequency value reports ![]() NAN Not a number. A data word indicating a measurement or processing error. Voltage overrange, SDI-12 sensor error, and undefined mathematical results can produce NAN. indicating that low signal strength amplitudes have occurred. The 0.01 mV threshold can be modified in the
NAN Not a number. A data word indicating a measurement or processing error. Voltage overrange, SDI-12 sensor error, and undefined mathematical results can produce NAN. indicating that low signal strength amplitudes have occurred. The 0.01 mV threshold can be modified in the VibratingWire() instruction.
Improving vibrating wire measurement quality
The following may improve measurement quality:
- Match frequency ranges to expected frequencies.
- Reject noise.
- Minimize resonant decay.
- Prevent spectral leakage.
Matching measurement ranges to expected frequencies
Measurements are best when the frequency ranges of the swept excitation and of the response analysis match the range of resonant frequencies expected from the sensor. The swept and analysis ranges for specific sensors are determined using the tools in ![]() Device Configuration Utility Software tool used to set up data loggers and peripherals, and to configure PakBus settings before those devices are deployed in the field and/or added to networks. Also called DevConfig. on the VW Diagnostics tab. Once determined, the ranges are then programmed into the CRBasic program by adjusting the
Device Configuration Utility Software tool used to set up data loggers and peripherals, and to configure PakBus settings before those devices are deployed in the field and/or added to networks. Also called DevConfig. on the VW Diagnostics tab. Once determined, the ranges are then programmed into the CRBasic program by adjusting the BeginFreq and EndFreq parameters in the VibratingWire() instruction.
Rejecting noise
More accurate readings can be obtained when the sensor is swept over narrower-frequency ranges. A narrow-frequency measurement reduces noise and yields a greater signal-to-noise ratio than a wide measurement. Sensors with frequency ranges below 450 Hz should work well even in the presence of 50 or 60 Hz noise; however, they should be characterized.
Check the manufacturer specifications for the sensor frequency and excitation ranges to help determine the swept frequency range.
Minimizing resonant decay
A narrow-swept range ensures minimal decay of the resonant response prior to measurement. Gage response starts to decay as soon as the frequency sweep moves past the resonant frequency. Observing this decay is difficult because the swept frequency overwhelms the resonant-frequency response while excitation is still active. Because wider excitation sweeps take longer, the resonant response decays for a longer time before the data logger can measure it. The resulting resonant amplitude is smaller.
Preventing spectral leakage
Matching the swept excitation to the expected resonant frequency range prevents spectral leakage from complicating the spectral analysis. Vibrating wire sensors are usually optimized for a single resonant frequency to overwhelm harmonic and sub-harmonic responses; so, spectral leakage usually has little impact. Measurements of poorly constructed vibrating wire gages that may have large harmonic and sub-harmonic responses are more susceptible to spectral leakage.